Supplementary Material
to:
An Introduction to Radio Astronomy
4th edition Cambridge University Press 2019
Last updated 19/08/2019
Chapter 3: Spectral Lines
Atomic Hydrogen:
(credit: http://www.jb.man.ac.uk/distance/exploring/course/content/module1/)
Pointers to the quantum physics of the transition
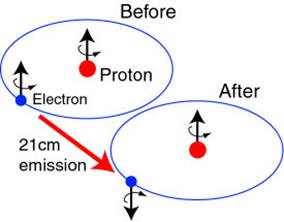
An illustration of the hyperfine “spin-flip”
transition in hydrogen which gives rise to the 21-cm line. The energy
difference between the two hyperfine states is small (~5.9 x 10⁻⁶ eV)
and the frequency of the line can be calculated quantum mechanically to very
high precision: it is 1420405751.7667 Hz (i.e. 1420.4… MHz). At first
sight the spin orientations of the electron and proton in the high and low
energy states may seem incorrect since the electron has an opposite charge to
the proton and hence its magnetic moment points in the opposite direction for a
given spin direction. But in reality the particle wavefunctions are not
spatially separated, as implied in the diagram, but overlap and there is
spin-spin coupling. An accessible
semi-classical description of this transition is given by D.J. Griffiths Am. J. Phys. 50, 698 (1982) Griffiths_HI.pdf
Observations
of the Milky Way with simple apparatus

As described in the text the 21 cm spectral line of atomic hydrogen (HI) was the first to be discovered in the early 1950s. The mean life of an excited atom is ~107 years as a result the volume emissivity and the surface brightness of HI emitting regions are low. However the interstellar medium of the Milky Way fills the antenna beam and hence HI is easily observable with simple apparatus (as left and below). The picture above shows a 1.25m parabolic dish equipped with a “cantenna” feed at primary focus being calibrated with microwave absorber as “hot load” (see also Supplementary Material, Chapter 6). An excellent source of information on low-cost radio astronomy and detection of the HI line is http://y1pwe.co.uk/RAProgs/index.html
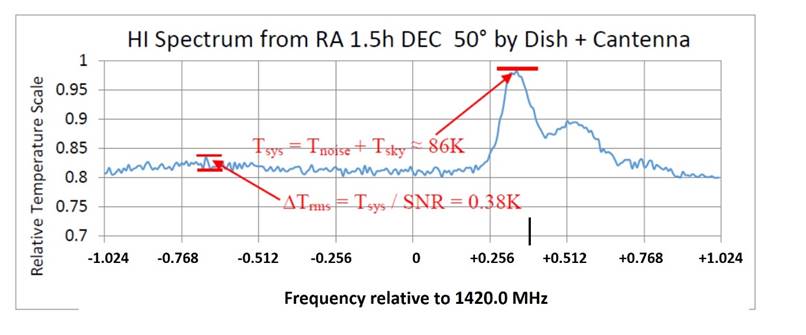
A hydrogen line
spectrum taken at Right Ascension 1.5h Declination +50o (galactic
longitude 130o; galactic latitude -12o) with the 1.25m
dish and cantenna system shown above (FWHM beamwidth 12o); the integration time was
10s. At this longitude the peak emission
falls close to zero radial velocity (i.e. 1420.4 MHz marked with short black
line). The line of sight is outside the
solar circle (see Figure 14.5a) so the Sun is moving towards the more distant
gas clouds whose radial velocity is negative i.e.
shifted up in frequency. Note that the
spectrum has not been corrected to the local standard of rest. (Image Credit: University of
Manchester MPhys report by HongYing
Chen and M. Cummings).
Further
references to HI in the Milky Way
For an introductory explanation of galactic HI observations which complements
Section 14.3 see http://www.jb.man.ac.uk/distance/radio/course/sourcesII/sourcesII4.html
The 7m dish of the Jodrell Bank Internet Observatory http://www.jb.man.ac.uk/distance/observatory/intro.php (follow
the links therein) is used for HI observations of the Milky Way and a few
nearby galaxies (M31/M33).
The EU-HOU initiative
(e.g. https://www.astro.uni-bonn.de/hisurvey/euhou/) is an excellent source of
instruction and information on galactic HI observations providing access to downloadable
spectra taken with large radio telescopes. See also the descriptive pages https://www.astro.uni-bonn.de/hisurvey/euhou/HI_Spirals_HowTo.pdf
The HI4PI all-sky survey
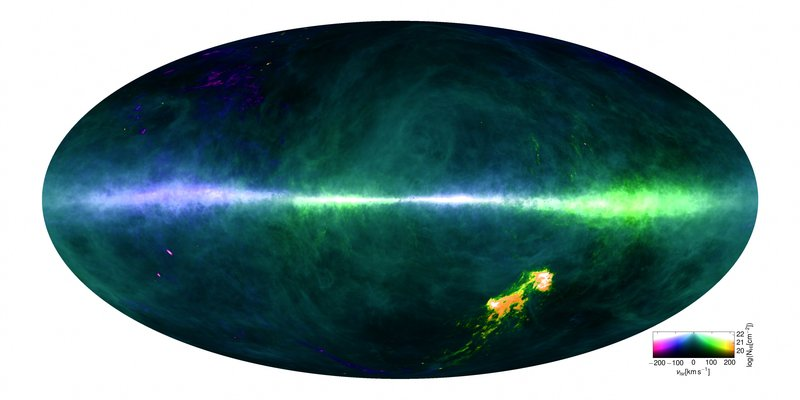
At the research level the HI4PI survey (HI4PI
collaboration, 2016, Astronomy &
Astrophysics 594, A116) is a complete hydrogen line survey of the sky made
with a combination of the 100-m Effelsberg telescope
in Germany and the 65-m Parkes telescope in Australia at an angular resolution
of 16.2 arcmin. In the image above (see https://www.mpifr-bonn.mpg.de/pressreleases/2016/13) the overall rotation of the Milky
Way galaxy is encoded by the different colours. The
bright emission in the bottom right quadrant is from the Magellanic
Clouds whilst the emission from the external galaxies M31 (Andromeda) and M33
can just be discerned in the bottom left quadrant. With large telescopes HI can
be observed in many nearby galaxies and the SKA will enable HI to be observed
in galaxies at cosmological distances.
Radio Recombination Lines
(RRLs):
The photon energies associated with electronic transitions in hydrogen and with the outer electron in other atoms extend to the radio regime for orbitals with high quantum numbers (see main text Section 3.1). Observations of RRLs enable physical conditions and chemical compositions in HII regions and the ISM to be determined. For a full discussion of RRL astrophysics see M.A. Gordon and R.L. Sorochenko “Radio Recombination Lines” Astrophysics and Space Science Library , pub. Springer (2007).
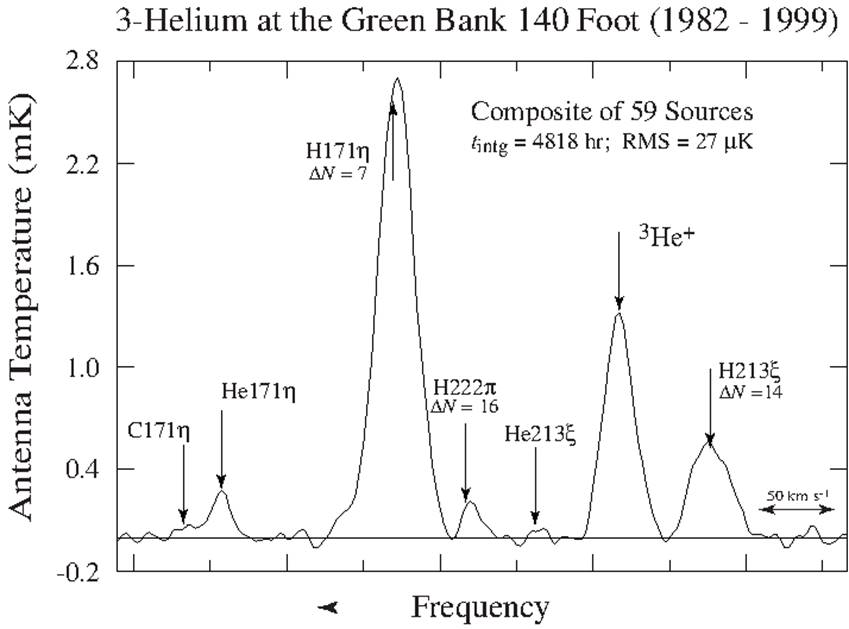
State-of-the-art RRL observations and the abundance of 3-Helium
The Helium Abundance: The 3He+
line at 8665 MHz (wavelength 3.46 cm) is the analogue of the spin flip in atomic hydrogen at 1420.4 MHz.
Establishing the cosmic abundance of 3He is of
cosmological importance as explained in “The saga of 3He”
by R.T. Rood, T.M. Bania and D.S. Balser Science 295, 804 (2002) and by the
same authors in “The cosmological density of baryons from observations
of 3He in the Milky Way”,
Nature 415,54 (2002).
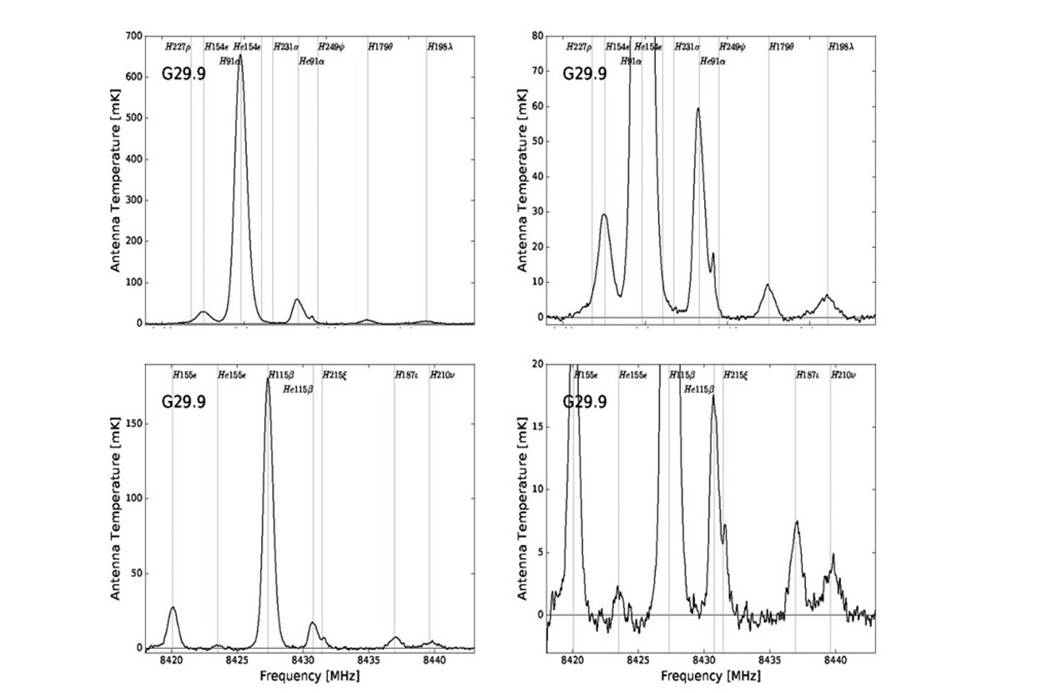
State of the art RRL spectra from the HII region
G29.9 taken with the Green Bank Telescope in selected frequency sub-bands
around 8430 MHz; the lines are all from hydrogen and helium. The sensitivity
afforded by the GBT system after a 45 hr integration
reveals many transitions with large differences between the values of n.
A full description of these observations is given by D.S. Balser
and T.M. Bania ApJ,
156:280 (2018) (Figure courtesy T. Bania and D. Balser).
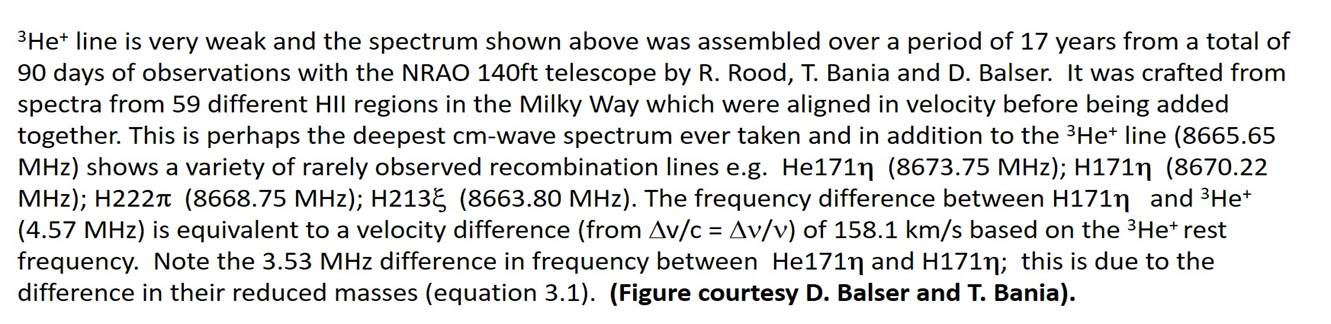
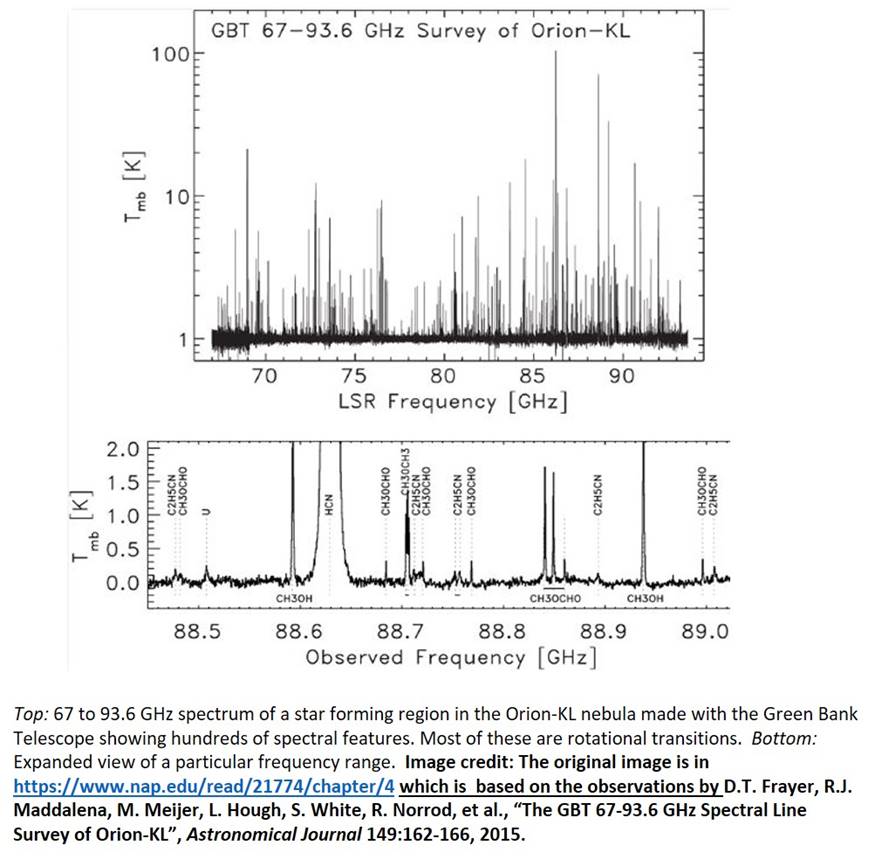
Molecules
Spectral scans of the Orion Nebula
Molecular spectral lines are associated with quantised rotational
transitions in molecules with electric dipole moments (see section 3.3). The
specific energies and hence frequencies are diagnostic of the molecular species
and at short cm and mm wavelengths the density of lines can be very high and
not all of them are identified. The figure below shows a spectral scan from 67 to 93.6 GHz of the Orion Nebula. At higher frequencies ALMA Band 1
observations reveal an even higher
density of spectral lines: see https://www.aanda.org/articles/aa/pdf/2017/08/aa30466-17.pdf
Masers
Masers are covered in both Chapter 3 (introduction to the theory) and in Sections 13.3 and 13.4 (observational results). In brief amplification by stimulated radiation within gas clouds occurs at spectral lines where energy levels are over-populated by high energy (often infra-red) radiation (see section 3.7). Galactic maser lines are very narrow (~ 1km/sec or less) and for maximum gain the radial velocity of the masing gas along the line of sight should be “coherent” i.e. not have significant Doppler shifts (Vlemmings & va Langevelde (2005) A&A 434 1021 also https://arxiv.org/abs/astro-ph/0501627). Masers have been detected in comets, stellar atmospheres, evolved stars, galactic star forming regions, star forming regions in external galaxies (especially Ultra-luminous Infra-Red Galaxies, ULIRGs) and Active Galactic Nuclei (AGN). The brightest masers detected in external galaxies are termed “megamasers” with the principal species being OH and H20. Water mega masers have been used to measure the distances to nearby galaxies (e.g. NGC 4258, see section 16.5.2). See also the observations presented in Supplementary Material Chapter 13. The book “Maser Sources in Astrophysics” (CUP, 2012) by Malcolm Gray is an up to date compendium of theory and observations.
The Zeeman Effect
The Zeeman effect is referred to in several places throughout the text but was not covered in Chapter 3. It arises when a line-emitting atom or molecule is situated in an external magnetic field. Energy levels which are degenerate in the zero-field case may then be split into different levels and the resultant spectral lines will then exhibit fine structure. In simple terms the splitting is due to the interaction between the external field and the magnetic dipole moment associated with the orbital angular momentum. For a basic introduction to the physics of the effect see:
http://hyperphysics.phy-astr.gsu.edu/hbase/quantum/zeeman.html
The astrophysical interest in the effect that Zeeman-splitting provides a direct route to measuring the magnetic field in a line emitting region. The magnitude of the (small) split depends on the field strength (parallel component) and the frequency of the line. A characteristic is that Zeeman split lines exhibit different hands of circular polarization; the observations involve taking the difference between the power in opposite hands. The effect was first observed in the 21-cm hydrogen line by Verschuur (1968) and a comprehensive introduction to this topic in the radio astronomy context has been given by Sault et al (1990).
Perhaps the main impact of Zeeman splitting is that it provides a route to measuring the magnetic fields in molecular clouds, with implications for the processes of star formation. Observations of OH and H20 masers are particularly useful. For a review of magnetic fields in molecular clouds, including a discussion of Zeeman observations, see Crutcher (2012).
References
Crutcher, R.M. (2012) Ann.Rev.Astr.Astrophys., 50, 29.
Sault R.J., Killeen, N.E.B., Zmuidzinas, J., & Lushin, R. (1990) Ap.J.Suppl., 74,437.
Verschuur, G.L. (1968) Phys. Rev. Lett. , 21, 775