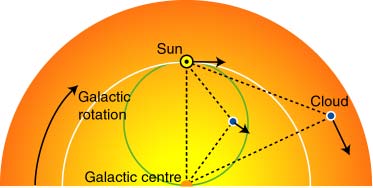
Figure 8. The geometry for measuring line of sight velocities from doppler shifts of 21-cm radio lines emitted by clouds of hydrogen gas orbiting in the disc of the Milky Way.
As we mentioned earlier the major advantage afforded by 21-cm line observations is that we can measure doppler shifts and hence relative velocities of the hydrogen gas. Of course since we are in the radio part of the spectrum we are unaffected by dust obscuration and can look all the way across the galaxy. A simple model of the relative velocities we should expect to measure is that of a rotating disk in which the Sun (our viewing point) is located about two thirds of the way out, Figure 8. In this circular approximation each cloud of gas orbits the centre of galaxy with a particular angular velocity which may be a function of radius. The velocity we measure from the doppler shift of the 21-cm line, called the radial velocity, is the difference between the velocities of the Sun and the cloud along the line of sight between them (marked with a dashed line). Outside the green circle drawn through the Sun and the galactic centre (the solar circle) the measurement of rotational velocity immediately gives the distance to the cloud (or vice versa). Inside the solar circle other techniques are used to resolve distance ambiguities. In the region outside the solar circle and to the right of the Sun we will measure negative radial velocities. This is illustrated in the real example shown in Figure 9. This is the result of measuring the 21cm radial velocities out through the galaxy from the Sun in the direction of Cygnus (pretty much the direction of the labelled cloud in Figure 8, also see Figure 10).
|
Figure 8. The geometry for measuring line of sight velocities from doppler shifts of 21-cm radio lines emitted by clouds of hydrogen gas orbiting in the disc of the Milky Way. |
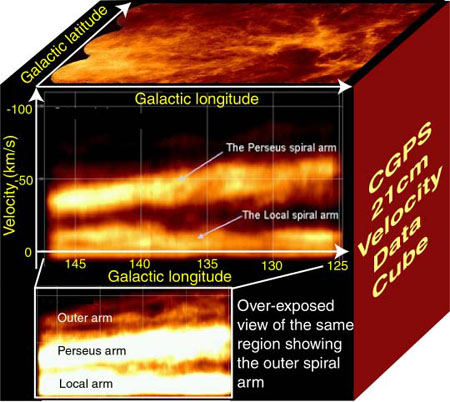 |
Figure 9. The 21cm line velocity datacube generated by the CGPS on a strip of sky running from Cygnus towards Cassiopeia (original data courtesy of CGPS). The cube has 3 dimensions, galactic longitude and latitude on the sky and, from the doppler shift of the 21cm line, the velocity relative to the Sun. |
On the top face of the "cube" shown in Figure 9 is a view of the strip of sky showing 21cm emission over a narrow frequency band which by doppler shift is equivalent to a range of velocities only 1 km/s wide. The survey itself contains similar 1 km/s wide images of this strip over a total range of more than 100 km/s. These individual images are stacked one on top of the other to form a "datacube" like that illustrated in the figure. Hence for each point on the sky we can look along the line of sight and see the velocity distribution of the hydrogen gas which, in the simple circular approximation, is directly related to distance. This is equivalent to probing down a vertical line through the datacube starting at some point on the top face. The front face of the cube shows a view through the datacube from the side revealing how emission varies as a function of longitude (horizontally) and velocity (vertically) i.e. the latitude direction has been summed together. It is immediately apparent that the hydrogen gas is not distributed evenly in velocity (or distance). In fact it is gathered into three main hydrogen-rich regions which we can identify with spiral arms. The local arm (the one in which the Sun is located) is obviously moving at about the same velocity as us, hence the velocity difference is zero. As we travel out towards Cygnus the next accumulation of hydrogen gas is the Perseus arm which is moving at a radial velocity of about -50 km/s. Finally we see that the much fainter outer arm is moving at even higher relative velocities. Compare this with the schematic of the Milky Way disc shown in Figure 10 to visualise the positions of these arms.
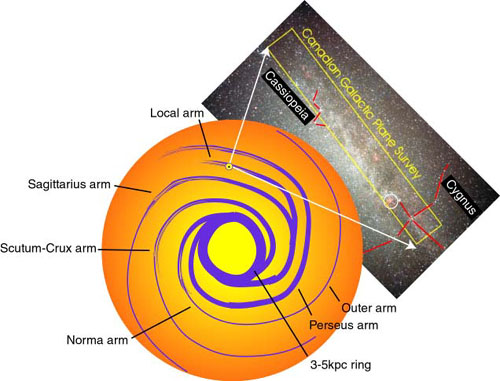 |
Figure 10. The location of the Canadian section of the International Galactic Plane Survey on the sky with respect to a schematic top-down view of the Milky Way. The Sun's position is marked on the galactic disc and the field of view of the survey is shown between the two arrowed lines. The constellations of Cassiopeia and Cygnus are marked on an optical view of the survey region (original data courtesy CGPS and Alan Dyer); the location of the North America nebula is indicated by a circle. |
| 6. What distribution of hydrogen emission as a function of velocity might you expect to see along a line of sight perpendicular to the plane of the Milky Way? [For example, coming towards you out of the plane of Figure 10.] |
21cm emission from the neutral hydrogen gas is extremely useful in revealing structures otherwise undetectable in the optical part of the spectrum. For example, Figure 11 shows the region around the spiral galaxy M81 in both optical and 21-cm radio emission. The 21cm image clearly delineates the spiral arms of M81 but also shows that the three galaxies visible in the optical image are all interacting and connected by streams of gas torn out of the galaxies by tidal forces.
Since the speed at which the gas clouds rotate around the galactic centre is directly related to the mass of the galaxy (the more massive the galaxy the faster the clouds rotate) measurement of a galaxy rotation curve allows us to weigh the galaxy. It is these observations by radio astronomers which are amongst the best evidence for a form of matter in the universe which we cannot see directly but whose presence can be deduced from its gravitational effects. This is the "dark matter". We will use one of the radio telescopes at Jodrell Bank to make observations of the 21cm line emission from our galaxy and others and hence estimate their masses. Figure 12 shows some recent detailed observations of the Pinwheel Galaxy, M33, clearly demonstrating the rotation of the neutral hydrogen galaxy disc. This disc is probably circular but is seen at an angle to our line of sight and so appears elliptical in projection.
![Optical (left) and 21cm radio (right) images of the region around the galaxy M81. [Courtesy NRAO]](../images/sourcesII/M81region.jpg) |
Figure 11. Optical (left) and 21cm radio (right) images of the region around the galaxy M81. [Courtesy NRAO]. |
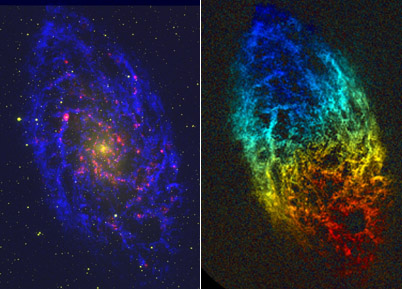 |
Figure 12. The spiral galaxy M33. At left is the 21cm radio emission (in blue) superposed on an optical image of the galaxy (in red). At right is the doppler information coded in red for material moving away from us and blue for that moving towards us. [Radio image taken with the VLA and the Westerbork Synthesis Radio Telescope in the Netherlands, David Thilker, Robert Braun, Rene Walterbos.] |
| 7. How would the velocity information coded into Figure 12 be affected if M33 were face-on to us i.e. we were looking directly down onto the disc of the galaxy? |