The Pynterferometer is a graphical interface designed to demonstrated
the techniques of radio interferometry used by telescopes like,
ALMA, e-Merlin, the JVLA and SKA, in a manner accessible to the
general public.
Version 1.0 was released in 2012. Version 2.0 has been updated (for Mac and Linux) for
ERIS 2015.
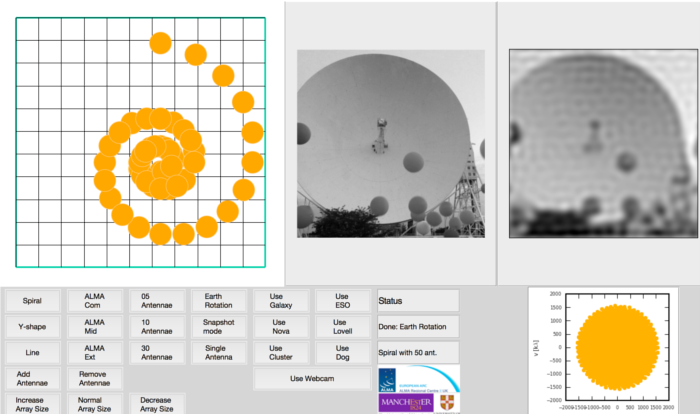
Interferometry is an observational technique used by astronomers to combine the signal from a few to tens to hundreds of individual small antennas to achieve high resolution images at radio and millimetre wavelengths. This graphical interface demonstrates how the number of antenna, their position relative to one another and the rotation of the Earth allow astronomers to create highly detailed images at long wavelengths.
The Pynterferometer is written in the Python scripting language
and runs on Windows (v1.0 only), Mac OSX and Linux. The Pynterferometer can be
downloaded
here along with a description
of the Python packages required to run the Pynterferometer.
A paper describing the Pynterferometer is available
here. If you do use the Pynterferometer please cite this article in some way at your demonstration, thank-you.