This material (including line art and animations) is copyrighted! See my copyright notice for fair use practices. Most of the ground-based telescope pictures here are from the Anglo-Australian Observatory (AAO---used by permission).
Our solar system is inside a large galaxy known as the Milky Way. All of the stars you can see at night and several hundred billion more are all bound together gravitationally into a huge cluster called a galaxy. Most of the stars in our galaxy are far enough away that they blend together in a thin band across the sky. If you are fortunate enough to view a dark sky outside of the glare of the city lights, you will see this milky band running through the constellations Cassiopeia, Perseus, Taurus, Monoceros, Vela, Crux, Norma, Sagittarius, Scutum, Aguila, Cygnus, and Lacerta. To people of long ago, this band looked like milk had been spilled along a pathway, so it was called the Milky Way. This chapter covers the radical discoveries made in the 20th century of the nature of the Milky Way and our place in it. The vocabulary terms are in boldface.
The discovery of the dust is relatively recent. In 1930 R.J. Trumpler (lived 1886--1956) plotted the angular diameter of star clusters vs. the distance to the clusters. He derived the distances from inverse square law of brightness: clusters farther away should appear dimmer. IF clusters all have roughly the same linear diameter L, then the angular diameter q should equal a (constant L) / distance. But he found a systematic increase of the linear size of the clusters with distance.
This seemed unreasonable! It would mean that nature had put the Sun at a special place where the size of the clusters was the smallest. A more reasonable explanation uses the Copernican principle: the Sun is in a typical spot in the Galaxy. It is simply that more distant clusters have more stuff between us and cluster so that they appear fainter (farther away) than they really are. Trumpler had shown that there is dust material between the stars! The extinction of starlight is caused by the scattering of the light out of the line of sight, so less light reaches us.
 Not all wavelengths are scattered
equally. Just as our air scatters the bluer colors in sunlight more efficiently
than the redder colors, the amount of extinction by the interstellar dust
depends on the wavelength. The amount of extinction is proportional to
1/(wavelength of the light). Bluer wavelengths are scattered more than redder
wavelengths.
Not all wavelengths are scattered
equally. Just as our air scatters the bluer colors in sunlight more efficiently
than the redder colors, the amount of extinction by the interstellar dust
depends on the wavelength. The amount of extinction is proportional to
1/(wavelength of the light). Bluer wavelengths are scattered more than redder
wavelengths.
The 1/l behavior of the scattering indicates that the dust size must be about the wavelength of light (on the order of 10-5 centimeters). Less blue light reaches us, so the object appears redder than it should. This effect is called reddening, though perhaps it should be called ``de-blueing''. If the dust particles were much larger (say, the size of grains of sand), reddening would not be observed. If the dust particles were much smaller (say, the size of molecules), the scattering would behave as 1/l4. Trumpler showed that a given spectral type of star becomes increasingly redder with distance. This discovery was further evidence for dust material between the stars. If the Sun is in a typical spot in the Galaxy, then Trumpler's observation means that more distant stars have more dust between us and them.
You see the same effect when you observe the orange-red Sun close to the horizon. Objects close to the horizon are seen through more atmosphere than when they are close to zenith. At sunset the blues, greens, and some yellow are scattered out of your line of sight to the Sun and only the long waves of the orange and red light are able to move around the air and dust particles to reach your eyes.
| dust | extinction | interstellar medium |
|---|---|---|
| reddening |
The hydrogen gas is observed in a variety of states: in ionized, neutral atomic, and molecular forms. The ionized hydrogen emits light in the visible band as the electrons recombine with the protons and the neutral atomic and molecular hydrogen emits light in the radio band of the electromagnetic spectrum.
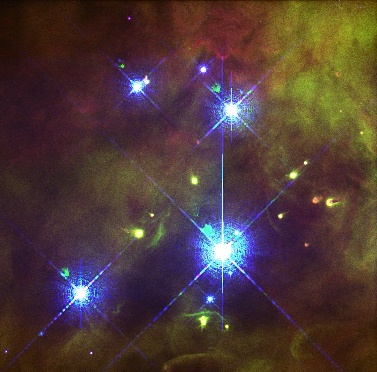
Below is a famous H II region called the Orion Nebula. It is the fuzzy patch you can see in the sword part of the Orion constellation. It is the closest large star formation factory to us and is explored in more detail in the stellar evolution chapter. Selecting the image will bring up a close-up of the heart of the nebula taken using the HST showing the four hot ``Trapezium''stars (four O and B stars making a trapezoid figure) at the center of the image.
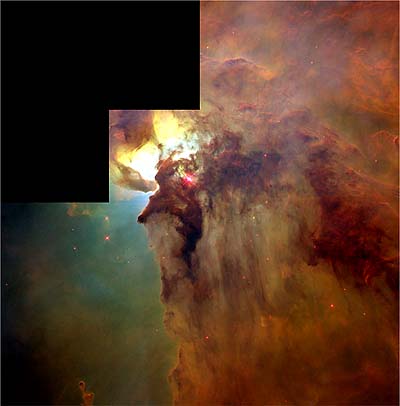
Another large H II region is the Lagoon Nebula in the constellation Sagittarius. It is about 5000 light years away and spans 90 by 40 arc minutes in our sky. Converting the angular size to a linear size, the Lagoon Nebula is about 130 by 60 light years in extent (the Orion Nebula is only 29 by 26 light years in size). The complex interaction of the intense radiation from the hot stars lighting up the nebula, varying densities of the gas and dust, and temperature differences creates twisted, turbulent features in the nebula that have been explored by the Hubble Space Telescope. Selecting the image will bring up the high-resolution image of the heart of the Lagoon Nebula from the Hubble Space Telescope.
Next to the Lagoon Nebula on our sky (but closer to us in space) is the Trifid Nebula, so-called because of the dust lanes that trisect the H II region behind them. The image below is nice one to illustrate the three types of nebulae: the red H II region behind a dark dust nebula (showing the effect of the extinction of light) and next to them a blue reflection nebula (showing the preferential scattering of shorter wavelengths).
O and B-type stars are only found in regions of star formation because they are young stars. These hot, very luminous stars do not live long enough to move away from where they were formed. Since stars form in clusters, where O and B stars are found, there are sure to be smaller, lower-mass stars still forming. The spectra of H II regions are much simpler than star spectra so they are easier to decipher. The composition and conditions inside the H II regions are easier to determine and understand than for stars, so H II regions provide a valuable tool for understanding the history of star formation in a galaxy.
H II regions also provide a convenient way to map the structure of a galaxy because they are so large and luminous. In our galaxy the H II regions are distributed in a spiral pattern. The best wavelengths to use to map the distribution of hydrogen, however, are in the radio band. Most of the hydrogen gas is not ionized because O and B stars are rare. Also, energy in the form of radio passes easily through dust.
Most of the hydrogen in space (far from hot O and B-type stars) is in the ground state. The electron moving around the proton can have a spin in the same direction as the proton's spin (i.e., parallel) or spin in the direct opposite direction as the proton's spin (i.e., anti-parallel). The energy state of an electron spinning anti-parallel is slightly lower than the energy state of a parallel-spin electron. Remember that the atom always wants to be in the lowest energy state possible, so the electron will eventually flip to the anti-parallel spin direction if it was somehow knocked to the parallel spin direction. The energy difference is very small, so a hydrogen atom can wait on average a few million years before it undergoes this transition.
Even though this is a RARE transition, the large amount of hydrogen gas means that enough hydrogen atoms are emitting the 21-cm line radiation at any one given time to be easily detected with radio telescopes. Our galaxy, the Milky Way, has about 3 billion solar masses of H I gas with about 70% of it further out in the Galaxy than the Sun. Most of the H I gas is in disk component of our galaxy and is located within 720 light years from the midplane of the disk. What's very nice is that 21-cm line radiation is not blocked by dust! The 21-cm line radiation provides the best way to map the structure of the Galaxy.
The rotation curve is a plot of the orbital velocity of the clouds around the galactic center vs. their distance from the Galaxy center. The term ``rotation'' in this context refers to the motion of the galactic disk as a whole---the disk made of stars and gas clouds appears to spin. The gas clouds are assumed to move in the plane of the disk on nearly circular orbits. Jan Oort (lived 1900--1992) found in 1927 that stars closer to the galactic center complete a greater fraction of their orbit in a given time than stars farther out from the center. This difference in the angular speeds of different parts of the galactic disk is called differential rotation.
The rotation curve can be determined by looking at the doppler velocities of hydrogen gas along different lines of sight. The 21-cm emission will include contributions of hydrogen at different distances from the galactic center and different doppler shifts with respect to us. Some of the emission will be from gas clouds just inside the orbit the orbit of the Sun moving at slightly faster angular speeds than the Sun. They will have a small redshift. The part of the total emission coming from gas closest to the galactic center will have the greatest redshift because that gas is moving at the greatest angular speed. In the figure below the line from the galactic center to the fast moving gas (called ``Rmin'') makes a 90° angle with respect to our line of sight. Using basic trigonometry, the distance of the fast moving gas (at ``A'') from the galactic center = (the Sun's distance)× sin[(galactic longitude)], where the galactic longitude is the angular separation between the cloud and the galactic center and sin() is the ``trigonometric sine'' function (it is the ``sin'' key on a scientific calculator). Angle by angle, strip by strip, the rotation curve is constructed from the maximum doppler velocity along different lines of sight.
Once the rotation curve is determined, the Galaxy's structure can be mapped. The 21-cm line profile has several doppler shifted peaks that are narrow and well-defined (see the figure below). Using the known rotation curve, you can convert the doppler speeds of the peaks to get the distance to the hydrogen producing each peak. The intensity of each peak depends on the density of the hydrogen gas cloud. The mapping surveys show that the hydrogen gas is distributed in a spiral pattern in a thin disk for almost all of the Galaxy.
Based primarily on observations of the CO emission, astronomers find that the molecules in the interstellar medium are clumped together into clouds with masses anywhere from just a few solar masses to over a million solar masses with diameters ranging from several light years to over 600 light years. Molecules need to have some sort of shielding from the high-energy light from stars. Otherwise, the energetic photons would dissociate the molecules. Molecular clouds have dust in them. The dust grains may provide the shelter for molecules to form. Compared to the size of atoms, the dust grains are enormous and have many pits and recesses for atoms to congregate and combine.
Stars form in the molecular clouds. If the molecular cloud is cold and dense enough, it can collapse under its own gravity. Smaller fragments can form and produce stars (see the stellar evolution chapter for further details). The Milky Way has about 2.5 billion solar masses of molecular gas with about 70% of it in a ring extending from 13,000 to 26,000 light years from the center. Not much molecular gas is located at 4,900 to 9,800 light years from center but about 15% of the total molecular gas mass is located close to galactic center within 4,900 light years from the center. Most of the molecular clouds are clumped in the spiral arms of the disk and stay within 390 light years of the disk midplane.
Molecular Hydrogen and Carbon Monoxide Connection
Molecular hydrogen H2 does not produce radio emission. It produces absorption lines in the ultraviolet. However, the gas and dust become so thick in a molecular cloud that the ultraviolet extinction is too large to accurately measure all of the H2 in the interior of the cloud. Fortunately, there is evidence of a correlation between the amount of CO and H2, so the easily detected CO radio emission lines (at 2.6 and 1.3 mm) are used to infer the amount of H2. The CO emission is caused by H2 molecules colliding with the CO molecules. An increase in the density of the H2 gas results in more collisions with the CO molecules and an increase in the CO emission.
Another nice feature of the CO radio emission is that its wavelength is small enough (about 100 times smaller than 21-cm line radiation) that even medium-sized radio telescopes have sufficient resolution to map the distribution of the molecular clouds. The higher resolution of large radio telescopes can be used to probe the structure of individual molecular clouds. There is some controversy about how the molecules are clumped together in the clouds. Is one gas cloud actually made of many smaller gas clouds? There is some evidence that indicates that 90% of the H2 is locked up in 5000 giant molecular clouds with masses greater than 105 solar masses and diameters greater than 65 light years. The largest ones, with diameters greater than 160 light years, have more than a million solar masses and make up 50% of the total molecular mass. Other studies indicate that the giants are actually made of smaller clouds grouped together into a larger complex.
| differential rotation | H II region | rotation curve |
|---|---|---|
| 21-cm line radiation |
![]() Go to
Galactic Structure -- Cepheids section
Go to
Galactic Structure -- Cepheids section