Premise: We aim to produce an open-source software package that can be used by Y-DNA professional and amateur researchers, which combines many of the existing tools and techniques available to the community. The package is designed so that it takes raw data in and compresses it into a small database for fast operations, cross-compares kits to produce a Y-SNP-based phylogeny, overlays Y-STR data onto that phylogeny and performs haplogroup estimation, overlays submitted geographical data onto each kit and computes migration pathways, and uses molecular clocks to associate nodes of the phylogenetic tree with historical periods. Taken together, this allows the researcher to chart the spread and diversification of a haplogroup through its migrations. The package will be run on R-L11, the major European haplogroup R1b clade, before being made available more widely.
Motivation and background: This project was borne out of two needs: a need to allow users to compare their Y-DNA results to understand their place in the phylogenetic tree, and a need to put that tree in a geographical and historical context. Most of the leading testing companies do not allow proper cross-comparison of datasets, and the academic community has not ventured into the small-scale population differences of these minor clades in any statistical sense. Yet there is a pressing desire for people taking Y-DNA tests to understand their family's ancient societal and migrational history. There are a number of tools made available by individual researchers, but none have been peer-reviewed, and there is considerable onus on people using these tools to provide ongoing curation of data. We want to combine these tools, submit their theory for peer review, and automate the processes linking them together. These processes include the haplotree creation and age analysis we have provided for R-U106 and R-P312 Build 37 BigY tests from Family Tree DNA, but also links together haplogroup prediction and geographical migration. The combination allows us to look at migration in a much more homogeneous context than we would otherwise be able to do, and provides an automated analysis with minimal curation for professional and amateur researchers going into the future.
Including data in this project: Data can be included in this project through the data submission portal. Instructions on how to obtain data from Family Tree DNA's BigY test are given on the site. Users of other tests should submit their raw data reports.
Data management and privacy: See statement and FAQs.
The project is divided into six work packages, which operate as modules within the code:
| Work package | Description | Status |
|---|---|---|
| A | Data import, filtering and insertion into database | 05 Jun 2018: Coding under test |
| B | Automated data processing to form the haplotree | 05 Jun 2018: Basic haplotree coding complete, working on automation and memory use |
| C | STR import, haplogroup estimation, clustering | 16 Jan 2019: Coding under test for ancestral STR haplotype estimation |
| D | Phylogeography and migration | 05 Mar 2018: In discussion with Hunter Provyn |
| E | Age analysis | 04 Jul 2018: Basic mathematical logic formulated, single-test coding complete, no trees yet |
| F | Collating reports, user interface | 05 Jun 2018: Awaiting previous work packages |
Project construction: The project is being constructed in Python 3, using an SQL database to store the data. The code will be released as open-source material under the GNU public licence, once its basic development is complete.
Source data: User-submitted data is being collected through the haplogroup-r project by explicit, informed consent. These can be combined with data from published studies of modern and ancient DNA. At present [09 Feb 2018] we have over 1500 submitted kits.
This package deals with the import and filtering of the large genetic datasets, into a coherent database that can be more readily used.
Problems: A Y-DNA dataset will typically cover around 10 million base pairs, but can cover up to 20 million. It can come in many formats, from raw (FASTQ) or aligned (BAM) data files, through variant call and coverage files (VCF/BED or gVCF), through lists of calls for individual variants. The format and quality information varies significantly by company and study, and each kit needs to be compared against every other kit. Over several thousand kits, this can easily become terabytes of data. We also need to homogenise the data, and reduce it to a series of calls with associated quality data.
Solutions: To solve the data processing problem, we are collapsing calls and coverage data into an SQL database. The binary, table-based approach allows much faster processing than the text-based approach of most variant comparison programmes. Variants will also be pre-filtered: we remove variants that are either shared among everyone or positive in no-one are removed, leaving only variants relevant for forming the phylogenetic tree. For 5,000 kits, this approximately reduces 12 million variants to 40,000 variants, or 60 billion calls to 200 million calls. The number of calls scales as roughly O(n3/2), so would be expected to be roughly 4.4 billion calls cross 110,000 variants for the 40,000 Y-DNA samples from the 100k Genomes project.
A number of other adaptations on our Build 37 approach are envisaged:
We will also continue the following approaches:
Progress: [05 Jun 2018] Code development by Jef Treece and Zak Jones now stands as follows. An SQL database has been set up which allows variants from VCF and BED files to be imported. Currently, we have only included FTDNA BigY Build 38 kits for these testing purposes. Genome coverage processing from BED files is being tested but appears to be working correctly. Import of other data sources will follow. Each kit takes ~17 seconds to process into the database, up from ~2 seconds in Build 37, as a result of the much larger file size. This represents a limitation on the speed at which testing can take place for large datasets. Ultimately, the idea will be to have a permanent SQL database that gets updated periodically.
This package takes the imported data, processes it into a phylogenetic tree and identified haplogroups defined by nodes in that tree.
Problems: There are a variety of techniques for producing phylogenetic trees already. However, for the size of problem we are addressing, they are often memory intensive. They can also be substantially CPU intensive, as the underlying tree structure must first be identified. Quality information on calls is often not taken into account, meaning low-quality but useful data is ignored. Problems can be created by incomplete or poor-quality data, which can vary significantly depending on the techniques used and the format of the received data. In our Build 37 code, we outlined an automated method of creating a haplogroup tree, but this required extensive manual curation of variants with back mutations, recurrent mutations, missing data and multiple derived alleles. We are seeking to further automate this to substantially reduce the curation involved.
Solutions: If an ancestral sequence is known, as in the human Y chromosome, this problem is greatly simplified, as the tree structure becomes simply a case of charting mutations from that ancestral sequence. This saves on CPU power. The careful filtering and binary conversion performed in Work Package A allows us to save on memory as well. The procedure for haplotree creation will follow the basics of our previous analysis, with some changes. Variants will first be sorted by quality, and processed in quality-coded batches. Good-quality variants will be used to form the basic haplotree, being first sorted by frequency, then by person to create clades, each one being checked for phylogenic accuracy as the list progresses. Later batches of lower-quality variants can then be inserted into existing clades, or form their own clade, provided they can be made phylogenically equivalent.
Progress: [05 Jun 2018] Code development by Zak Jones and Jef Treece stands as follows. A basic matrix of calls has been produced and sorted, creating a matrix structure akin to the Build 37 reports. A sorting algorithm can now produce clade structures from test data, including automated interpolation of missing data. We are working with test data to refine the algorithm and ensure it makes the correct decisions.
The code is now general portable and undergoing unit testing on groups of around 100 tests. Currently, this takes around 3 GB of RAM to process and scales roughly as O(N3/2). This is prohibitively large for our required database size (currently around 2500 kits), so we are looking at ways to make the programme more memory efficient. Issues also exist with specific variants which cannot reliably be assumed to be negative (based on absence from the VCF file but within the coverage of the BED file). Currently, these are dealt with as manually applied exceptions. We are working on ways to treat these automatically.
This package calculates ancestral Y-STR motifs for each node in the phylogenetic tree. It then uses those motifs to perform haplogroup estimation on individuals who have either taken non-sequencing SNP-based tests (SNP packs or panels, individual SNPs), or not taken any SNP tests at all. This allows a wider set of data to be collected on individuals in each haplogroup.
Problems: For personal or financial reasons, many Y-DNA testers do not choose to take full Y-chromosomal sequencing tests, instead opting to only obtain Y-STR and/or simpler Y-SNP results. However, these results can still provide useful data for the phylogeographical analysis of Work Package D, if we can predict a haplogroup for them. We can simultaneously provide these testers with a more accurate measure of their deep ancestry. The main problems encountered here are that not every haplogroup has a corresponding Y-STR signature, that Y-STR and clade-defining Y-SNP mutations do not have to happen contemporaneously, and that Y-STR back mutations and convergent mutations occurring in different lines obfuscate the analysis.
Solutions: Existing solutions to the haplogroup estimation problem include vector-based methods, binomial theorem and Bayesian methodology. Existing implementations of these methods suffer from problems that affect our analysis, whether it is defaulting to the best-fitting haplogroup (rather than the most-accurate one) or whether it is poor removal of false positives in the case of convergent clades. In this analysis, we adopt for a robust solution, choosing the oldest node in the phylogenic tree that that kit is deemed likely to be a part of (to some given tolerance).
Progress: [16 Jan 2019] After a hiatus in operations, a test version of this package can now reliably produce ancestral STRs for different haplogroups. However, issues with missing values mean this is not yet ready to be implemented for age analysis without biasing the results. Work in ongoing to improve algorithms to recover the missing values where possible, and to treat probabilistically those that cannot be reliably recovered.
The table below shows the current state of the string from kit 120386 (bottom) to the R-S1894 common ancestor (near top), referenced to the known ancestral motif for R-DF98 (top row). Green shows correctly recovered mutations. Yellow shows corerctly recovered mutations that occur between R-DF98 and R-S1894. Blue shows correctly reproduced non-mutated states which are not linked to the most-ancestral haplotype (R-S1894). Red shows missing values. Only the first 37 STRs are shown out of the total 565.
| Known R-DF98 | 13 | 24 | 14 | 11 | 11-14 | 12 | 12 | 12 | 13 | 13 | 29 | 16 | 9-10 | 11 | 11 | 25 | 15 | 19 | 28 | 15-15-16-17 | 11 | 11 | 19-23 | 16 | 14 | 16 | 17 | 35-38 | 12 | 12 |
| R-S1894 | 13 | 24 | 14 | 11 | 11-14 | 12 | 12 | 12 | 13 | 13 | 29 | 17 | 9-10 | 11 | 11 | 25 | 15 | 19 | 15-15-16-17 | 11 | 11 | 19-23 | 16 | 14 | 17 | 0-38 | 12 | |||
| R-FGC14758 | 13 | 24 | 14 | 11-14 | 12 | 12 | 13 | 13 | 29 | 17 | 9-10 | 11 | 11 | 15 | 19 | 15-15-16-17 | 11 | 11 | 19-23 | 16 | 14 | 17 | 0-38 | 12 | ||||||
| R-FGC14759 | 13 | 24 | 14 | 10 | 11-14 | 12 | 12 | 13 | 13 | 13 | 29 | 17 | 9-10 | 11 | 11 | 26 | 15 | 19 | 28 | 15-15-16-17 | 11 | 11 | 19-23 | 16 | 14 | 17 | 18 | 38-38 | 11 | 12 |
| R-FGC14764 | 13 | 24 | 14 | 10 | 11-14 | 12 | 12 | 13 | 13 | 13 | 29 | 17 | 9-10 | 11 | 11 | 26 | 15 | 19 | 28 | 15-15-16-17 | 11 | 11 | 19-23 | 16 | 14 | 17 | 18 | 38-38 | 11 | 12 |
| R-FGC14762 | 13 | 24 | 14 | 10 | 11-14 | 12 | 12 | 13 | 13 | 13 | 29 | 17 | 9-10 | 11 | 11 | 27 | 15 | 19 | 28 | 15-15-16-17 | 11 | 11 | 19-23 | 16 | 14 | 17 | 18 | 37-38 | 11 | 12 |
Values are missing either because the haplotypes of individuals are missing (e.g. the only individual that defines the R-FGC14758xFGC14759 branch), or because no modal value can be defined from the immediate parent and child clades. Ignoring these markers will not include the mutations that occur on them, significantly biasing the ages to lower values. A full probabilistic treatment scales as approximately O(N2), so is not practical for more than a handful of missing markers.
This package analyses geographical information from users and performs a phylogeographical analysis on them. For our analysis, the input data will be the place of origin of individuals' most-distant known genealogical ancestors. We will also gain a relative frequency of each clade at a country level.
Problems: The geographical origins of clades is a particularly fraught issue. Commonly used methods include STR-variance-based approaches, which fail to capture migrations accurately, as only a few founding migrants have to take part in a migration for the STR variance of the ancestral population to be carried with them. With our dataset, we have the added difficulty that our population is inhomogeneously sampled: most tests come from diaspora from the British Isles (particularly the USA), while the legal ambiguity surrounding testing in countries such as France, and the lower uptake of testing in the economically poorer countries of Eastern Europe means that we have very different sampling rates among modern European populations. There is also the mathematical complexity surrounding the inclusion of ancient DNA results into this analysis, and the weighting that should be given to them.
Solutions: Using our haplotree, we can now adopt a STR-based clade-by-clade approach. Proto-typing of this approach by Peter Paluszewski (priv. comm.) shows it has potential to be useful for our purposes. A version of this methodology is currently implemented by Hunter Provyn.
Haplogroup frequencies for our R1b test clade are sufficiently numerous in the literature that we can compute a country-level debiasing factor that accounts for differences in the population sampling rate. This should allow us to recover accurate origins for each clade, provided they are sufficiently well-tested to be proportionally represented in high-weight countries.
For clades with a European origin, proto-typing suggests we can obtain an origin to within a radius of a few hundred km (or sometimes less) for populous clades - sufficient to distinguish between modern countries or ancient cultural groups. For groups with a large British component, we can identify the localisation in the British Isles to a radius of around 100 km or less, sufficient to examine origins on a regional level.
This package performs age analysis on the assembled phylogenetic tree, using a "molecular clock" treatment of mutations.
Problems: A variety of phylogenic age analyses alreaady exist (e.g. Saillard's rho statistic, the BEAST's relaxed molecular clock method, Adamov's clade-based mutation count for SNP-based trees; Walsh's Bayesian algorithm and Slatkin's variance method for STR-based analyses). STR-based analyses suffer from problems with back mutations and convergent mutations, and the asymmetric nature of many STR mutations. While these problems are not insurmountable, their treatment requires care. Existing SNP-based methods can suffer from bias from finite mutation counts (ages of clades cannot be negative), causality (parent clades cannot be younger than their children), differing clade sizes (leading to incorrect weighting), differing coverage (implying a different mutation rate), and/or an inability to include non-genetic sources of information. The systematic accuracy of mutation rates and any internal variations (among individuals or in different parts of a chromosome) also needs addressed.
Solutions: The occurrence of rare events like genetic mutations is governed by Poisson statistics. In our previous analysis, we devised a method by which ages were calculated using Poisson distributions based on the number of observed mutations, thereby retaining the full probability distribution of each dataset and providing the correct weighting for each child clade to the age of its parent. By applying this to the phylogenetic tree in both directions (top-down and bottom-up), a causally based time-index can be created. In this version, we abstract this to a generalised probability distribution, which can be described as the convolution of many arbitrary probability distributions. These can come from sources such as genealogical information, shared surnames, or carbon-dating of ancient DNA. A mutation rate is calculated per-test, based on the coverage it shares with other testers in its clade: this accounts for the large differences in test coverage that exist between different types of test in this analysis.
To address the problem of the unknown mutation rate, we are compiling a list of samples where two or more testers share a known common ancestor. This currently [09 Feb 2018] stands at 212 individuals with 25,000 years of known, independent lineages among them. This analysis currently provides a mutation rate of 7.38 (95% c.i. 5.71-9.32) x 10-10 mutations per base pair per year, in line with existing studies. A lower limit to ages (an upper limit to mutation rate) can be inferred from the ancient DNA samples that form part of our analysis.
We also aim to provide an independent measure of age from STRs, using the expanded sample of 500 Y-STRs that will be extracted from Family Tree DNA's Big Y test. This will require estimation of the mutation rates of each new STR marker, which can be done in a relative sense by bootstrapping, since the mutation rates of their original set of 111 Y-STR markers is known. This therefore provides increased relative accuracy in STR-based ages, but will retain the +/- circa 15% systematic uncertainty.
The accuracy of ages in our previous analysis is +/- circa 300–700 years. This is dominated by the small number of available mutations, thus sets a lower limit to the accuracy achievable in the new analysis. We should be able to improve on this accuracy by incorporating higher-coverage tests and Y-STR data.
Progress: [27 Jun 2018] The basic mathematical framework that describes this method is complete, and an internal document has been made describing how this can be achieved. Several steps of calibration are still necessary.
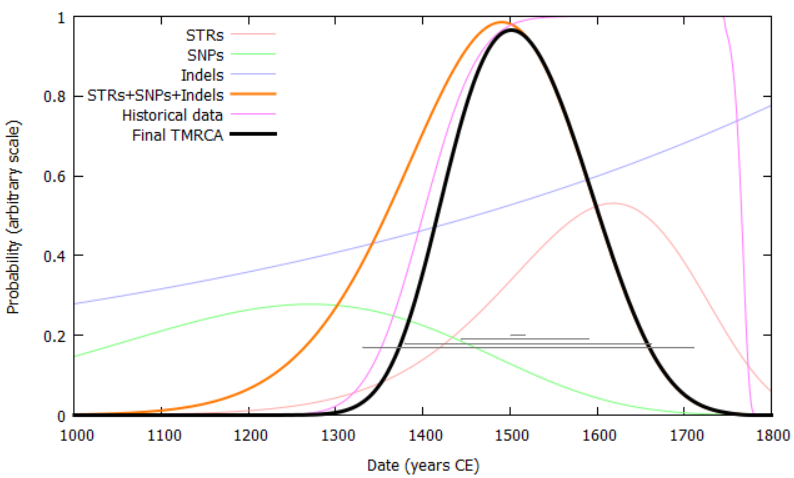
We have developed an age-analysis method which combines information from Y-SNPs, indels and Y-STRs to provide the most precise ages possible for nodes in the phylogenic tree, accounting for back-mutation, multi-step mutation and convergent mutation of Y-STRs. Accuracy can be further improved by incorporating results from ancient DNA and paper genealogies.
Several small issues still need to be solved, e.g., ancient DNA samples that cannot be placed reliably in one particular clade, the best weighting to obtain Y-STR haplotypes for each clade, the computation of weights for conversion of genetic distant to number of mutations, and the treatment of multi-copy Y-STR markers. Calibration of various parameters also needs to be performed, which is expected to be an ongoing process as we apply the code to real data.
Update: [04 Jul 2018] A basic framework has been encoded to allow a full age comparison for two people. Final coding to the whole tree structure will rely on Work Package A being complete, in order to provide formatted inputs and a phylogenic architecture from which to work. However, this setup can currently account for semi-arbitrary restrictions by paper trails, Y-SNPs, indels, and the full set of 561 Y-STRs, including accounting for back mutations and multi-step mutations. Multi-copy markers are not yet supported properly.
This package provides the user interface for the final reports. It will require merging of the above Work Packages to provide time-indexed migration reports for individual haplogroups, and a database interface to allow users to access individual results.
Detail to be added as modules are constructed.