|
|
The Sun
|
|
|
The Sun
|
In the previous module we learnt how the light elements were formed soon after the Big Bang. However our bodies are not composed purely of hydrogen and helium. The other elements that we see within us and around us must have been manufactured since that time. It turns out that the factories for the heavier elements are the stars.
Before we begin the story of the creation of heavy elements in stars we need to understand a few basic observable properties of stars.
Imagine a SETI astronomer sat at the controls of a radio telescope poised to search for radio transmissions from distant stars. One of the first decisions to be made is where the telescope should be pointed; this process of constructing a target list is one of the most important tasks in any programme of observational astronomy. Table 1 lists characteristics of the first two stars ever investigated in a SETI programme (Frank Drake's Project Ozma in 1960). In fact these two stars are still on the target list of the SETI Institute's current major programme Project Pheonix, their popularity stemming from the fact that they are the two nearest Sun-like stars.
Table 1. Characteristics of two popular target stars for SETI observations.
| Name | RA | Dec | V magnitude | Spectral type | Distance |
|---|---|---|---|---|---|
| Tau Ceti | 1h 44m 4.1s | -15d 56m 15s | 3.5 | G8V | 11.8 l.y. |
| Epsilon Eridani | 3h 32m 55.9s | -9d 27m 30s | 3.7 | K2V | 10.7 l.y. |
The table lists several characteristics which we will learn about during this course. In this module we will address the definition of magnitudes and spectral types.
The column headed V magnitude in Table 1 refers to the apparent brightness of the stars. The magnitude system for comparing stellar brightnesses was introduced by Hipparchus in the first century BC when he classified stars into six 'magnitude classes', first magnitude stars being the brightest, sixth magnitude ones the faintest.
This was formalised by Pogson in 1854 and is now defined by a system which has the following properties:
 Which is brightest, a magnitude 13 star or a magnitude 8 star? What is the
factor by which it is brighter?
|
 What is the ratio of brightnesses of two stars of magnitudes 11.2 and 13.2?
|
|
|
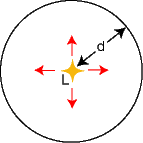
Figure 1. Star radiating luminosity L into a sphere of radius d. |
|
|
(1) |
because this energy is spread out over the surface of a sphere of
radius d which has surface area ![]() , Figure 1.
, Figure 1.
The luminosity is independent of distance and is therefore telling us something about the star's intrinsic brightness whilst the flux is providing information on the star's apparent brightness as seen from the Earth. So, if we could move a star farther away from us, its intrinsic brightness (luminosity) would not change but its apparent brightness (flux) would be reduced. Equation 1 quantifies the famous inverse square law.
The formal definition of the apparent
magnitude m of a star in terms of its flux F is
| (2) |
where C is a constant. The factor -2.5 and the value of C are chosen to approximate the scale to that of Hipparchus and to define the zero point (i.e. the flux which corresponds to zero magnitude).
It follows from the definition above that for two stars (subscripts 1 and 2)
| (3) |
In other words the difference in their magnitudes relates directly to a ratio of apparent brightnesses i.e. fluxes.
 Make sure you can derive equation (3).
 |
The faintest stars which one can see with the naked eye under optimum observing conditions have visual magnitudes of about 6 (this is known as the naked eye limiting magnitude). With large telescopes and modern detectors it is possible to reach magnitudes as faint as 28.
 Use equation (3) to show that stars of magnitude 28 are about half a
billion times fainter than the naked eye limit.
|
We can substitute for F in equation (2) to
find
| (4) |
where D is another constant. Note that this magnitude measures the apparent brightness of a star and is therefore termed the apparent magnitude as it is a function of the star's distance d. A lowercase m is always used to represent an apparent magnitude.
It is also useful to define an absolute magnitude which depends only on the
star's intrinsic brightness. Then a comparison of two stars' absolute
magnitudes would allow you to immediately say which of the two were actually
the brighter
and it wouldn't matter how far away each were. The absolute
magnitude M (note the use of a capital M) is defined to be the
apparent magnitude a star would have if it were moved to a
standard distance d = 10 parsecs.
Hence, from equation (4), absolute magnitude is given by
| (5) |
The difference between the apparent and absolute magnitudes of a star
is then just given by subtracting equation (5) from equation (4):
| (6) |
This difference depends only on a star's distance d (measured in parsecs) and is usually referred to as the distance modulus.
Table 2 lists characteristics of some typical astronomical objects.
Table 2. Characteristics of several astronomical objects.
| Star | Apparent magnitude |
Distance (parsecs) |
Absolute magnitude |
Luminosity (relative to Sun) |
|---|---|---|---|---|
| Sun | -26.8 | 4.8 | ||
| Full Moon | -12.6 | |||
| Venus | -4.4 | |||
| Sirius | -1.44 | 2.64 | 1.45 | 22.5 |
| Arcturus | -0.05 | 11.25 | -0.31 | 114 |
| Vega | 0.03 | 7.76 | 0.58 | 50.1 |
| Spica | 0.98 | 80.40 | -3.55 | 2250 |
| Barnard's Star | 9.54 | 1.82 | 13.24 | 1/2310 |
| Proxima Centauri | 11.01 | 1.30 | 15.45 | 1/17700 |
 Is Sirius brighter or fainter than Spica (a) as
observed from Earth and (b) intrinsically?
What is the distance modulus of Sirius? Why should this be a negative number?
|
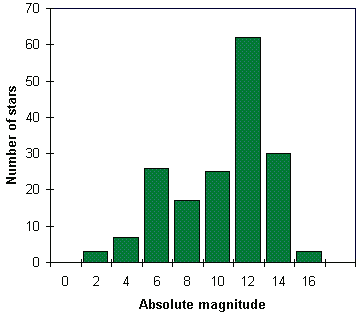
It is worth noting that the Sun is actually fairly bright compared to a typical star. Figure 2 shows that a typical star in the solar neighbourhood has an absolute magnitude of between 10 and 12. The Sun itself at an absolute magnitude of 4.8 lies in the column labelled 6 (magnitudes in the range 4-6).
|
|
Figure 2. The frequency distribution of the absolute magnitudes of all stars within 10 parsecs of the Sun (from the Hipparcos database). |
In our discussion above, apart from a brief reference to the concept of bolometric luminosity, we didn't consider whether the flux we were measuring from a star was the light collected over a wide range of wavelengths or just from a narrow range e.g. a specific colour. In fact, astronomers have to be clear about what wavelength range a magnitude refers to.
If we could gather the light from a star across the whole range of the electromagnetic spectrum i.e. radio to gamma rays, then we would be measuring a bolometric magnitude. Of course, it is virtually impossible to measure a bolometric magnitude, partly because of absorption of some wavelengths in the Earth's atmosphere, but also because detectors/telescopes are not equally sensitive across all wavelengths. Therefore any given observation only detects some fraction of the total flux arriving at the Earth. In practise, the observer uses a filter to isolate some waveband of interest, this then determines the magnitude system.
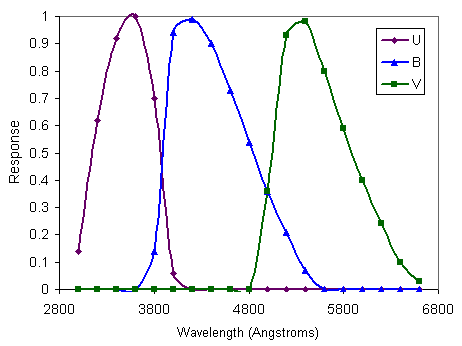
The discussion is here confined to the area around the optical part of the electromagnetic spectrum. So-called narrow-band filters have typical widths of about 50 Angstroms (an Angstroms is 10-10m, so this is equivalent to 5 nm), whilst broad-band filters are about 1000 Angstroms wide. The commonest system of broadband filters, due to Johnson and Morgan, is the system of UBV filters, see Figure 3.
|
|
Figure 3. The UBV filter system. The three curves show the relative response as a function of wavelength for the U, B and V filters. For example, we see that the V filter only transmits light of wavelengths between about 4800 and 6800 Angstroms and is most sensitive to light of about 5400 Angstroms. |
A V-band magnitude is then referred to as ![]() or just
or just ![]() , for an
apparent magnitude, and
, for an
apparent magnitude, and ![]() for an absolute magnitude. V stands for
visual, B for blue and U for ultraviolet. Note that the equations in
the previous section which were written in terms of unspecified
magnitudes could have been written down in exactly the same form for
V-magnitudes or any other bandpass as long as one remembers the
luminosity (in the case of absolute magnitudes) or flux (in the case
of apparent magnitudes) is that measured in the same bandpass.
for an absolute magnitude. V stands for
visual, B for blue and U for ultraviolet. Note that the equations in
the previous section which were written in terms of unspecified
magnitudes could have been written down in exactly the same form for
V-magnitudes or any other bandpass as long as one remembers the
luminosity (in the case of absolute magnitudes) or flux (in the case
of apparent magnitudes) is that measured in the same bandpass.
The UBV system was originally defined by Johnson & Morgan with a specific
telescope/filter/instrument combination. Now observations are
calibrated with respect to a set of standard stars whose magnitudes in
this system are defined. The
wavelengths of peak transmission of various filters in the extended system are:
U-360 nm, B-440 nm, V-550 nm, R-700 nm, I-900 nm,
J-1.25![]() m, K-2.2
m, K-2.2![]() m, L-3.4
m, L-3.4![]() m, M-5.0
m, M-5.0![]() m, N-10.2
m, N-10.2![]() m and Q-21
m and Q-21![]() m.
m.
Of course, a star observed through a filter which transmits only some fraction
of the light incident upon it will appear fainter than if all its light
were being measured. This difference is quantified as the bolometric
correction (BC), which is defined as the difference between the
bolometric magnitude and the V magnitude via
| (8) |
it is therefore always negative.
 Why is the bolometric correction always negative?
|
The constant ![]() in equation (2) determining the zeropoint of the
magnitude scale was originally
defined so that the star Vega had visual and blue apparent magnitudes
in equation (2) determining the zeropoint of the
magnitude scale was originally
defined so that the star Vega had visual and blue apparent magnitudes
![]() but has since been redefined so that the Sun has visual and blue
absolute magnitudes
but has since been redefined so that the Sun has visual and blue
absolute magnitudes ![]() and
and ![]() .
.
The colour of a star can be parameterised by taking the ratio of
brightnesses at two different wavelengths. In other words,
when we say a star is
particularly red we are actually comparing how bright it is in the red part
of the spectrum to how bright it is in the blue part.
Since the magnitude scale
is logarithmic this ratio of brightnesses
is equivalent to taking the difference of two
magnitudes, see equation (3).
Astronomers call a difference of two
magnitudes from different wavebands a colour index. For example,
| (9) |
Another commonly used colour index is ![]() .
.
Note that cooler (and therefore redder) stars have larger values of
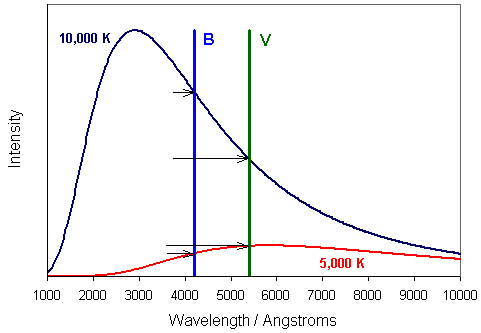
![]() . For example, Figure 4 depicts continuous spectra of two
stars, one much hotter than the other. You should recognise these as blackbody spectra
emitted because a star is a hot, largely opaque, glowing ball of gas.
The central wavelengths at
which the blue (B) and visual (V) magnitudes are measured are
indicated. We see that the hot star is brighter in the B region than
in the V region of the spectrum; therefore, its B magnitude is smaller
than its V magnitude, and it has a negative
. For example, Figure 4 depicts continuous spectra of two
stars, one much hotter than the other. You should recognise these as blackbody spectra
emitted because a star is a hot, largely opaque, glowing ball of gas.
The central wavelengths at
which the blue (B) and visual (V) magnitudes are measured are
indicated. We see that the hot star is brighter in the B region than
in the V region of the spectrum; therefore, its B magnitude is smaller
than its V magnitude, and it has a negative ![]() color index. The
opposite is true for the cool star.
color index. The
opposite is true for the cool star.
|
|
Figure 4. Comparison between the continuous spectrum of light emitted by two stars of different temperatures. The hotter star with temperature 10,000 K emits more light in the blue (short wavelength) part of the spectrum, the cooler star at 5,000 K is much redder. The diagram also depicts the central wavelengths of the B and V filters (see Figure 3). The arrows indicate the brightness of the stars in each of these filters, see text. |
The space between the stars is not empty - it is filled with tenuous gas
and clouds of dust that astronomers call the interstellar medium or ISM.
The observed brightnesses and
colours of stars are modified by the effect of
the ISM through which the light passes on its
way to the Earth. In general, the effects of absorption and scattering
by dust in the ISM result in the light from the star appearing
fainter and redder. For the typical sizes of dust grains in the ISM, this is
referred to as Rayleigh scattering in
which the angle through which the light is scattered is
![]() .
Hence blue light (shorter wavelength) is scattered out of
the beam and the object appears redder. This is the same effect that
makes the sky appear blue.
.
Hence blue light (shorter wavelength) is scattered out of
the beam and the object appears redder. This is the same effect that
makes the sky appear blue.
The colour index
![]() that we measure after the light has been modified by the ISM
is related to the intrinsic colour index
that we measure after the light has been modified by the ISM
is related to the intrinsic colour index
![]() that the star itself
emitted via
that the star itself
emitted via
| (10) |
where ![]() is the colour excess.
Note that if the star is reddened, then this is a positive number.
is the colour excess.
Note that if the star is reddened, then this is a positive number.
 Why is E(B-V) a positive number when the star is reddened?
|
For normal regions of the ISM the colour excess is directly related to the
amount by which the star's brightness is reduced. In fact, the
visual extinction ![]() (the number of V magnitudes
by which the star appears dimmer) is given by
(the number of V magnitudes
by which the star appears dimmer) is given by
| (11) |
Note that distance modulus is affected by interstellar extinction in
the sense that because the star appears fainter
we would think the star was farther away when in fact
it is just being observed through a significant density of
interstellar medium. Equation (6) for distance modulus is then modified to:
| (12) |
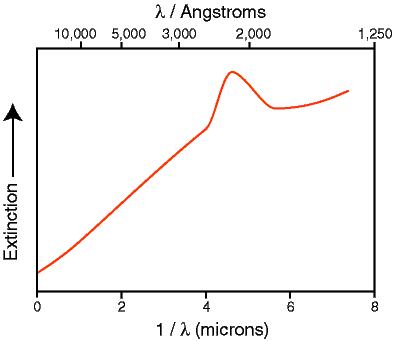
The amount of extinction varies as a function of wavelength such that it is highest at short wavelengths and lowest at longer wavelengths, see Figure 5. overall, extinction is roughly inversely proportional to wavelength. This is why extinction curves like that of Figure 5 are usually plotted with the inverse of wavelength (the so-called wavenumber) on the horizontal axis; in which case the curve is then flattened to a straight line at least through the visible part of the spectrum. Note the 2200 Angstrom bump in Figure 5 which is probably due to the presence of carbon in the form of spherical graphite grains in the ISM.
|
|
Figure 5. The average galactic extinction curve showing the increasing dimming effect of interstellar dust as wavelength decreases. The upper horizontal axis is just wavelength measured in angstroms whereas the lower horizontal axis is wavenumber with wavelength measured in microns (1 micron = 10,000 Angstroms). |
 By what factor is the visual brightness of an object at the galactic
centre reduced if it suffers from 30 magnitudes of visual extinction?
|
 Do you think astronomers are more likely to investigate regions of high
extinction, such as the galactic centre or star-forming regions,
at infrared or optical wavelengths?
|
Comparing the brightness of two stars using broadband filters like B and V gives us crude information on the colour of the star. More detailed investigations can be made by splitting the light from the star into a spectrum using a spectrometer (the light is dispersed using a prism or a diffraction grating - similar to the effect one sees when looking at light reflected from a compact disc). In fact, spectroscopy can provide astronomers with information about the chemical content, densities, temperatures and velocities of the material which is emitting the light.
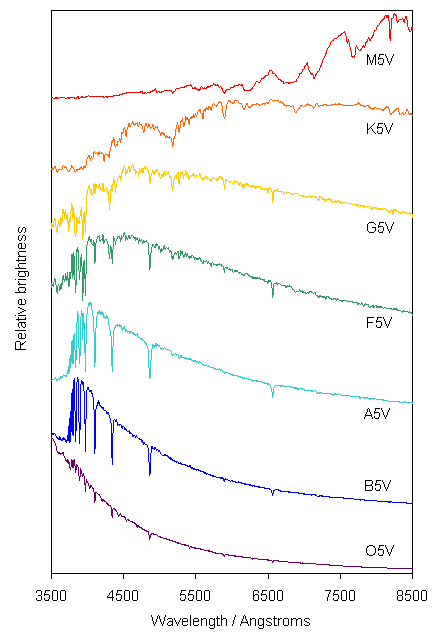
When astronomers first collected spectra from a large number of stars it was realised that they could be classified according to their spectral type. In the standard MK system the spectral type is defined by a letter (O, B, A, F, G, K or M) and a number 0 to 9. The sequence then runs O0, O1, O2... O8, O9, B0, B1... and so on up to M9. Representative spectra for spectral types O5 through M5 are shown in Figure 6. You see that O stars are bluest and M stars are reddest. By analogy with the heating of solid objects which change colour from a dull red to blue-white as they increase in temperature we see that the spectral type is telling us about the temperature of the star (just as with colour index although with more detail). Note that the hotter stars are sometimes termed 'early-type' and the cooler ones 'late-type'.
|
|
Figure 6. A compilation of actual spectra from stars of different spectral types. Each spectrum is shifted vertically by an arbitrary amount to separate it from its neighbours (data from Pickles 1998). |
You might also notice in Figure 6 that the spectra are not smooth (in contrast to our simple examples of Figure 4). Rather they are punctuated by dips at particular wavelengths. For example, note the dip at about 4860 angstroms visible in several of the spectra and strongest in the A-type star. We have met this phenomenon several times before - when we discussed redshifts of galaxies and the abundances of chemical elements. You should remember that these dips are caused by absorption of the light from the hotter inner regions of the star's atmosphere by hydrogen gas in the cooler outer layers. These features are therefore referred to as absorption lines. Most stellar spectra show a large number of different absorption lines from a variety of chemical elements including some molecules such as water and titanium oxide. In fact, the classification into spectral types is made according to the relative strengths of various absorption lines and is effectively a sequence of temperatures, see Table 3 (note 'metals' is the term used by astronomers to refer to all elements other than hydrogen and helium!).
Table 3. The MK spectral classification scheme.
| Spectral type | Temperature / K | Colour | Dominant absorption lines |
|---|---|---|---|
| O | >20,000 | Hottest blue stars | Ionized helium, strong ultraviolet continuum |
| B | 20-10,000 | Hot blue stars | Neutral helium dominates (He I) |
| A | 10-7,000 | Blue/blue-white stars | Neutral hydrogen (H) dominates |
| F | 7-6,000 | White stars | Singly ionized calcium (CaII), neutral H weaker, other metals |
| G | 6-5,000 | Yellow stars | Ca II dominates, neutral metals (e.g. iron - FeI) |
| K | 5,000-3,500 | Orange-red stars | Neutral metals (Ca, Fe) dominate, molecular bands appear |
| M | 3,500-2,000 | Coolest red stars | Molecular bands dominate (e.g. titanium oxide - TiO), neutral metals |
You may have noticed that the spectral types in Table 1 and labelled in Figure 6 have a letter V attached to the end. In fact, this is not formally part of the spectral type but is a second parameter called the luminosity class defined by the ratio of strengths of various pairs of absorption lines. It is written as a roman numeral in the range I to VII. Stars like the Sun are luminosity class V. In effect this is a sequence of density in the stellar atmosphere - stars which are brighter for the same effective temperature must be larger and therefore have more tenuous, less dense, outer layers. They follow the scheme given in Table 4.
Table 4. Luminosity classes of stars.
| Ia | Ib | II | III | IV | V | VI | VII |
|---|---|---|---|---|---|---|---|
| Brightest | ... | ... | ... | ... | ... | ... | Faintest |
| Lowest density | ... | ... | ... | ... | ... | ... | Highest density |
| Bright supergiants | Supergiants | Bright giants | Giants | Subgiants | Main sequence | Sub-dwarfs | White dwarfs |
The sun is of type G2V with effective temperature 5800K.
 This java exercise lets you experiment with fitting blackbody curves to the spectra
from stars of various spectral types.
|
In 1911, Ejnar Hertzprung plotted the first diagram of the relative magnitudes of stars in a cluster versus their spectral types. Two years later Henry Russell, working independently, produced a plot of the absolute magnitude of nearby stars with well-determined distances against their spectral types. The resulting diagram has come to be known as the Hertzprung-Russell or HR diagram. It is one of the most useful diagrams in astronomy and is fundamental to our understanding of stars.
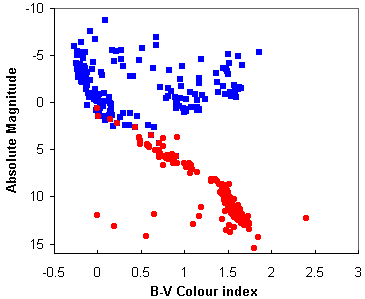
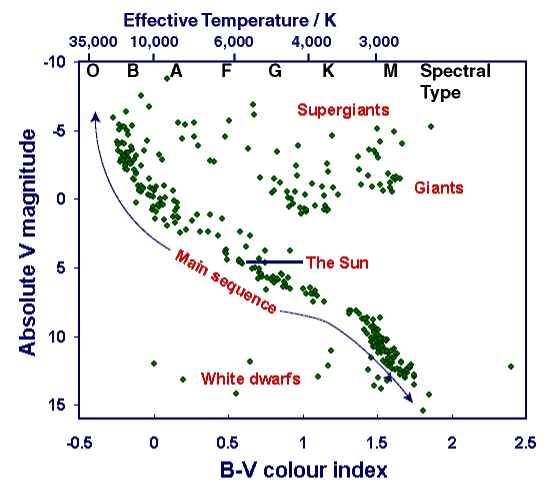
The HR diagram is plotted with intrinsic brightness (or any other equivalent quantity e.g. luminosity or absolute magnitude) on the vertical axis, increasing upwards, and effective temperature (or colour index or spectral type) on the horizontal axis, increasing to the left. The most common HR diagrams are called colour-magnitude diagrams after the quantities which are plotted. Figure 7 is an HR diagram constructed from data extracted from the catalogue made using observations with the Hipparcos satellite.
|
|
Figure 7(a). A composite HR diagram containing two datasets - all the stars closer than 10 parsecs (red circles) and all the stars with apparent magnitudes brighter than 3 (blue squares) - data from the Hipparcos catalogue. Here account has been taken of each star's distance so that brightness can be measured in absolute visual magnitudes. [Note this diagram gives a false representation of a typical HR diagram as the top half is artificially over-populated by forcibly including the bright stars - as we discussed earlier most stars are actually fainter than the Sun.] |
 |
|
Figure 7. Same as (a) except here the lower horizontal axis is labelled in B-V colour index and the upper axis with spectral type and effective stellar temperature in degrees Kelvin. A number of luminosity classes are also marked: VII, the faintest (white dwarfs); V (main sequence); III (giants); and I, the brightest (supergiants). |
The main points to note from Figure 7 are that 90% of stars lie on a narrow diagonal band running from top left (bright and hot) to bottom right (faint and cool). This is called the main sequence. The sun lies approximately in the middle of the main sequence. Giants and supergiants are much more luminous for a given temperature, lying above the main sequence and generally at the cooler end (the right) of the HR diagram. Far below the main sequence are the faint white dwarf stars.
As we shall see in the next few modules when we consider the sun and the evolution of stars the HR diagram is an invaluable tool in modern astronomy.
You should now understand the astronomical magnitude system for measuring brightnesses, the characterisation of colour by the colour index and the spectral classification of stars via spectral types and luminosity classes. We will go on in the next module to look at a typical main sequence star, our own Sun, and investigate in particular its source of energy.
|
|
The Sun
|