George Bendo's Webpages:
Teaching Material
Professional astronomical images and other data are freely available on the web in many places, mainly in a format called FITS. However, most of the general public is unaware that they can download these images and perform their own science. This webpage features a guide about using the DS9 image viewer to view and examine these FITS images, a couple of Python-based Jupyter notebooks describing how to convert the FITS images to jpg format, and several computer-based experiments that could be performed by secondary school or undergraduate university students.
Related to this, my image gallery page features many images in jpg format that I have created from professional astronomy data as well as links to the data used to create the images.
Contributors to the lab scripts on this webpage include Adam Avison, Rebecca Freestone, Ishmaeel Iqbal, Edward Meehan, and Ana Torres Campos. Multiple students and University of Manchester staff have also been involved with testing the lab scripts or providing feedback.
For secondary school teachers or university instructors that may want to use these lab scripts with their students, I am available to provide instructions either in person (within the Greater Manchester area) or remotely via videocon. This could include, for groups of students, one-day masterclasses or, for instructors, training in using the software and performing the experiments. Anyone who wants additional information should contact me at george.bendo(at)manchester.ac.uk.
Guides
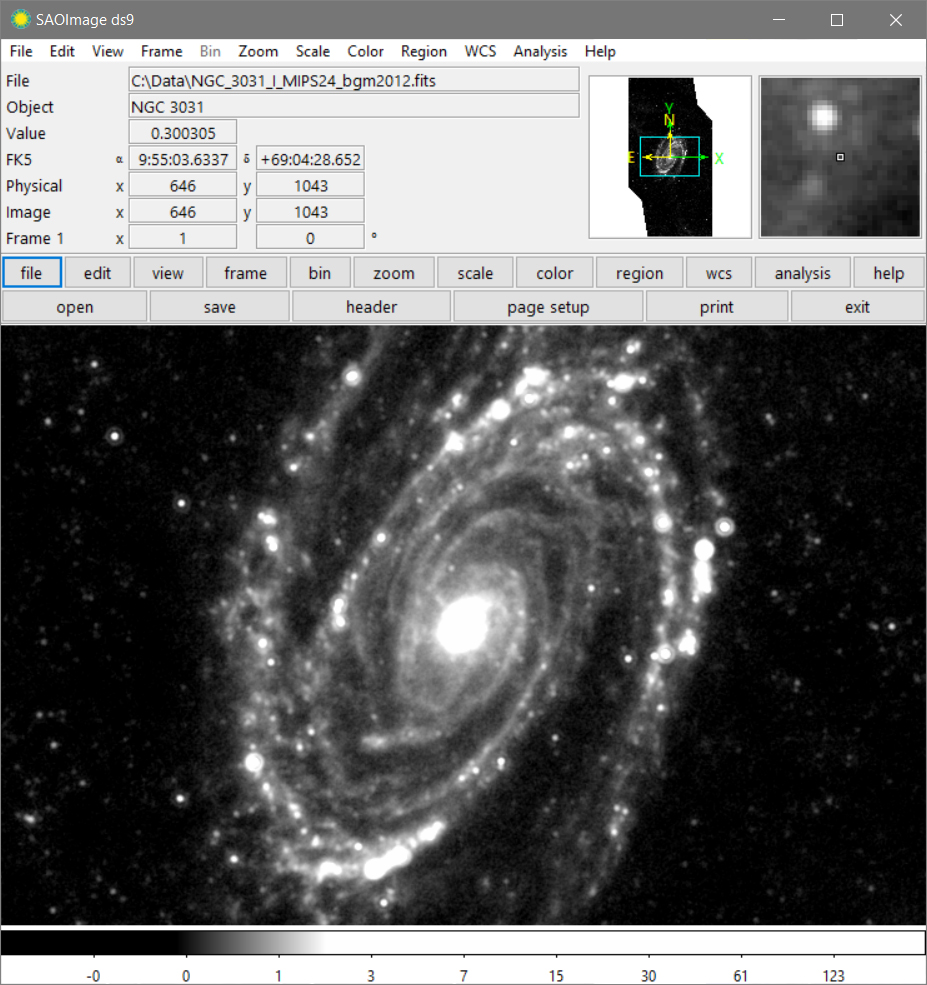
Introduction to Astronomy Images and the DS9 Image Viewer
I have written a guide for using this program that includes a brief introduction to computer images and FITS images, information on getting started with DS9, an overview of the program's features, and instructions on using some of the features in DS9. The end of the guide also has some information on where people can find FITS images that they can freely download.
The Spanish language version of the guide was created by Ana Torres Campos for outreach in Mexico.
Jupyter Notebooks
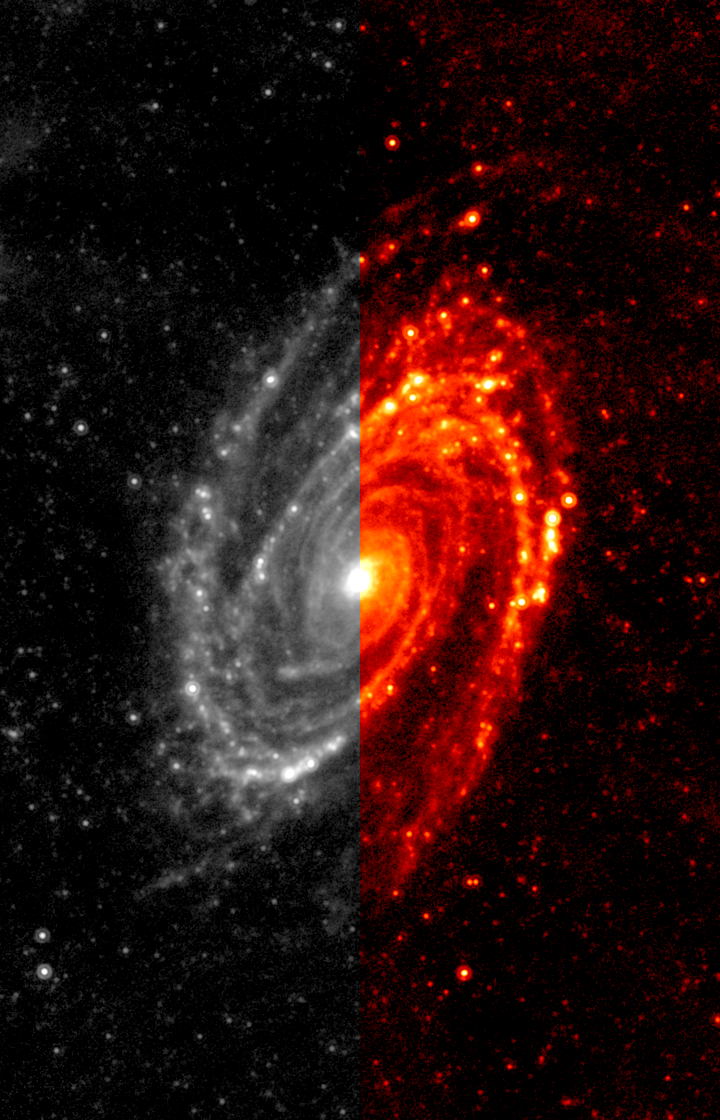
Image Colorization Demonstration Script (Using False Color)
Astronomers typically store their images in the FITS format. This format has the advantage of being able to store numbers in scientific notation, but to create versions of the images that people can display on their computers, those numbers need to be converted to integer values running between 0 and 255. Additionally, different conversions need to be applied to create separate red, green, and blue channels, which are then combined together to create an RGB false color image.
This demonstration script shows how to do this using the mid-infrared image of M81 that I published myself (Bendo et al., 2012, MNRAS, 423, 197) and is available from this link. However, the script can be modified to work with any image.
The example jpg image here shows how half of the image has been converted to a greyscale jpg and how half the image has been colorized.
Demonstration Script for Creating Representative Color Images
Astronomers typically store their images in the FITS format. This format has the advantage of being able to store numbers in scientific notation, but to create versions of the images that people can display on their computers, those numbers need to be converted to integer values running between 0 and 255. Additionally, many FITS images often cover only one wavelength of light. To show colours, three different FITS images covering different wavelengths are used to represent the red, green, and blue colors in a new image. These types of images can be called representative color images.
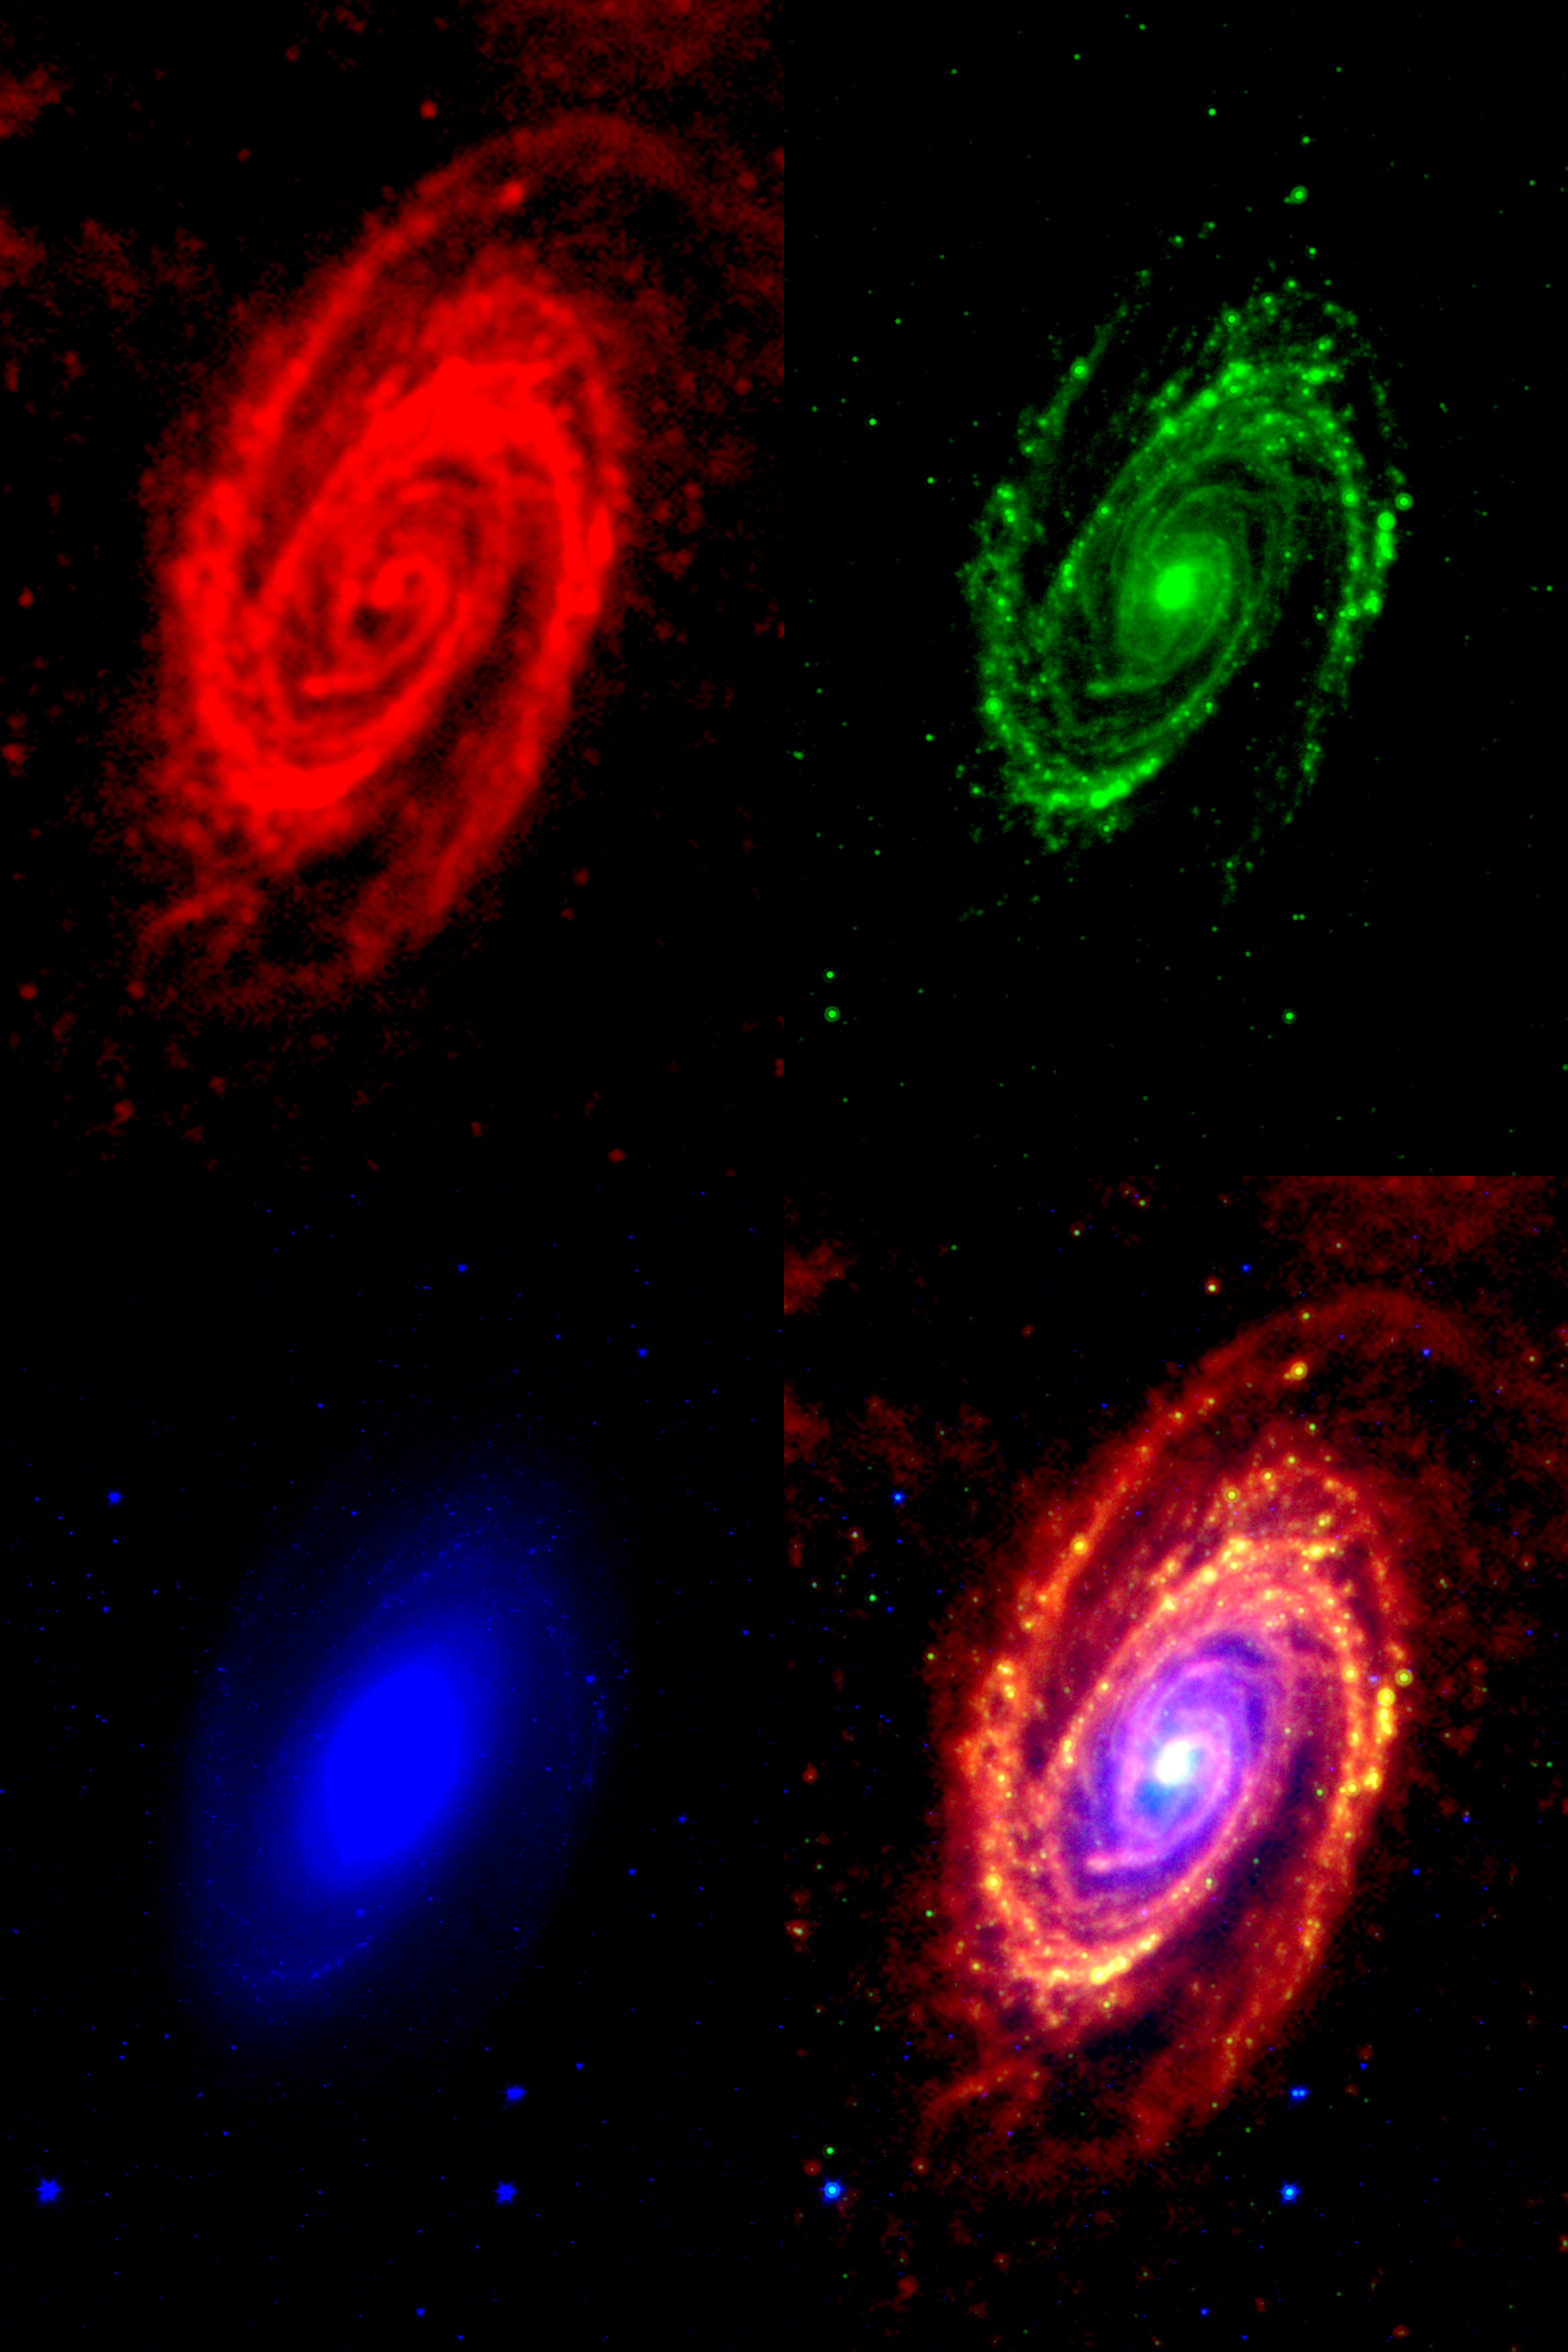
This demonstration script shows how to do this using three infrared image of M81:
- Red image (far-infrared image of cold interstellar dust)
- Green image (mid-infrared image of hot interstellar dust)
- Blue image (near-infrared image of starlight)
The example panels here shows how the three images listed above were converted into separate red, green, and blue images before being combined to produce the image in the bottom right corner of the mosaic.
Lab Scripts
Analysis of Globular Clusters Using Colour-Magnitude Diagrams
Lab Script (PDF)
Model Data (text format)
Model Data (Excel format)
University level
Lab Script (PDF)
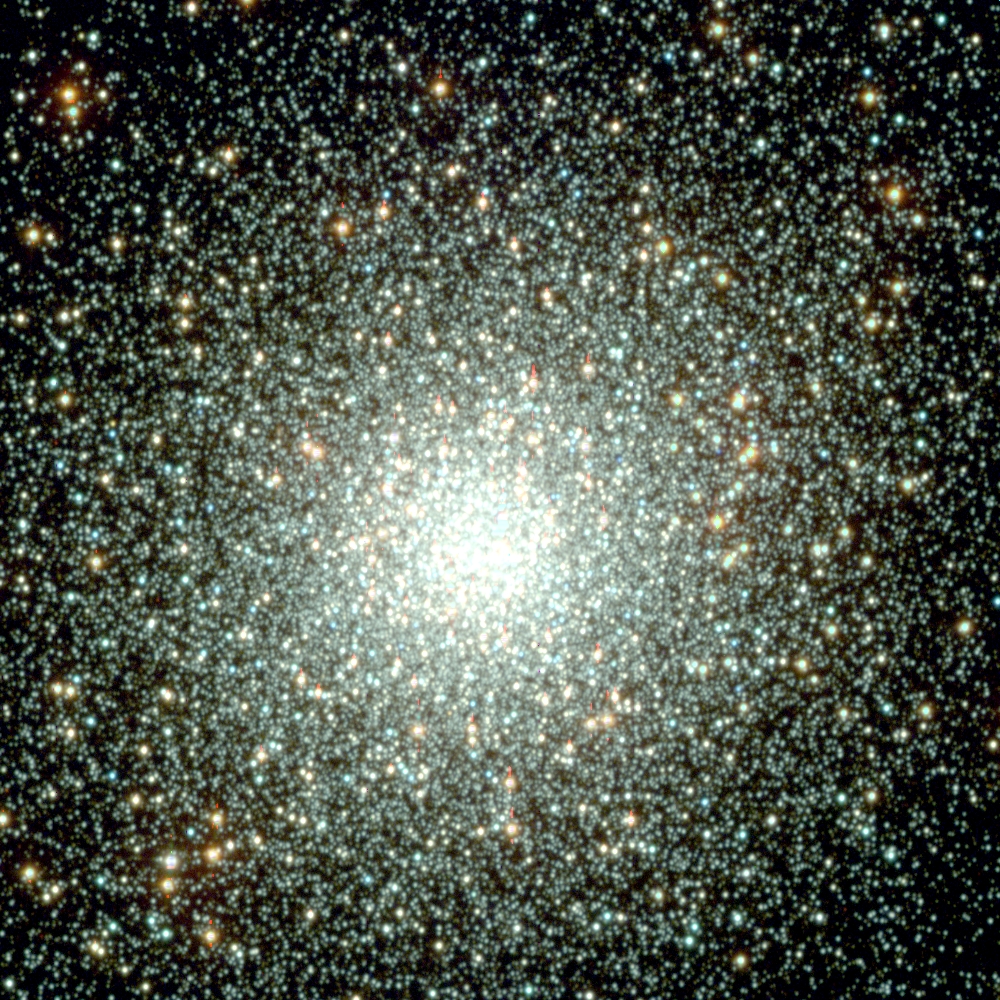
The ages of clusters of stars as well as the amount of heavy elements present in the stars can be determined by plotting the relation between the stars' colors and brightnesses (or magnitudes). This experiment guides students through using this approach to identify the ages and heavy element content of a globular cluster.
To perform this experiment, seconday students will not only need the lab script but also the model data, which is provided in plain text and Excel formats from links up above. (University students can generate their own data using the Dartmouth Stellar Evolution Database.)
Displayed here is a near-ultraviolet (3543 Angstrom) / blue (4770 Angstrom) / near-infrared (7625 Angstrom) image of M5 (NGC 5904) based on data from the Sloan Digitized Sky Survey (SDSS) Collaboration. The images are available from these links:
Comparing Ultraviolet and Infrared Star Formation Tracers
Lab Script (PDF)
University level
Lab Script (PDF)
The places where stars are forming can be identified by looking for the emission assocated with bright, hot stars with short lifespans. In this experiment, students can compare ultraviolet light emitted from these hot stars and infrared light emitted by interstellar dust around the young stars to examine the effectiveness of each of these star formation tracers.
The image here shows the near-ultraviolet (2267 Angstrom) emission in blue and the mid-infrared (24 micron) emission in red from the spiral galaxy M74. The star forming regions appear bright in one or both bands. The ultraviolet image was published by M. Brown et al. (2014, ApJS, 212, 18) and can be downloaded from this link. The mid-infrared image is one that I created myself and is available from this link.
Dark Matter in M81
Lab Script (PDF)
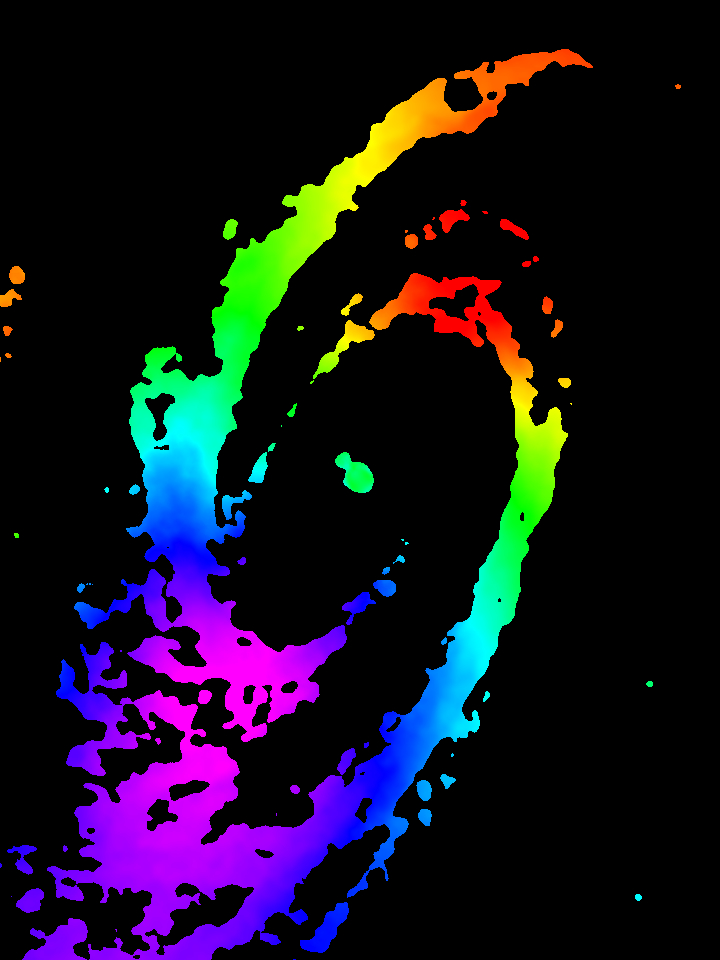
Dark matter is a form of matter that neither produces nor aborbs any form of electromagnetic radiation but that does exert gravitational forces on stars and interstellar gas. This experiment illustrates the techniques used for identifying dark matter in a spiral galaxy. The masses of the stars and interstellar gas are measured using data from the Spitzer Space Telescope and radio data from the Jansky Very Large Array. These are then compared to the mass inferred from the rotation of the interstellar gas within the galaxy. Typically, galaxies need more mass to hold themselves together than what is found in just the stars and gas.
The image here shows the rotation of the interstellar hydrogen gas within M81 as measured by The HI Nearby Galaxy Survey, with red colours representing gas moving away from the Earth and blue colours representing gas moving towards the Earth.
Measuring Distances to Galaxies using the Tully-Fisher Relation
Lab Script (PDF)
University level
Lab Script (PDF)
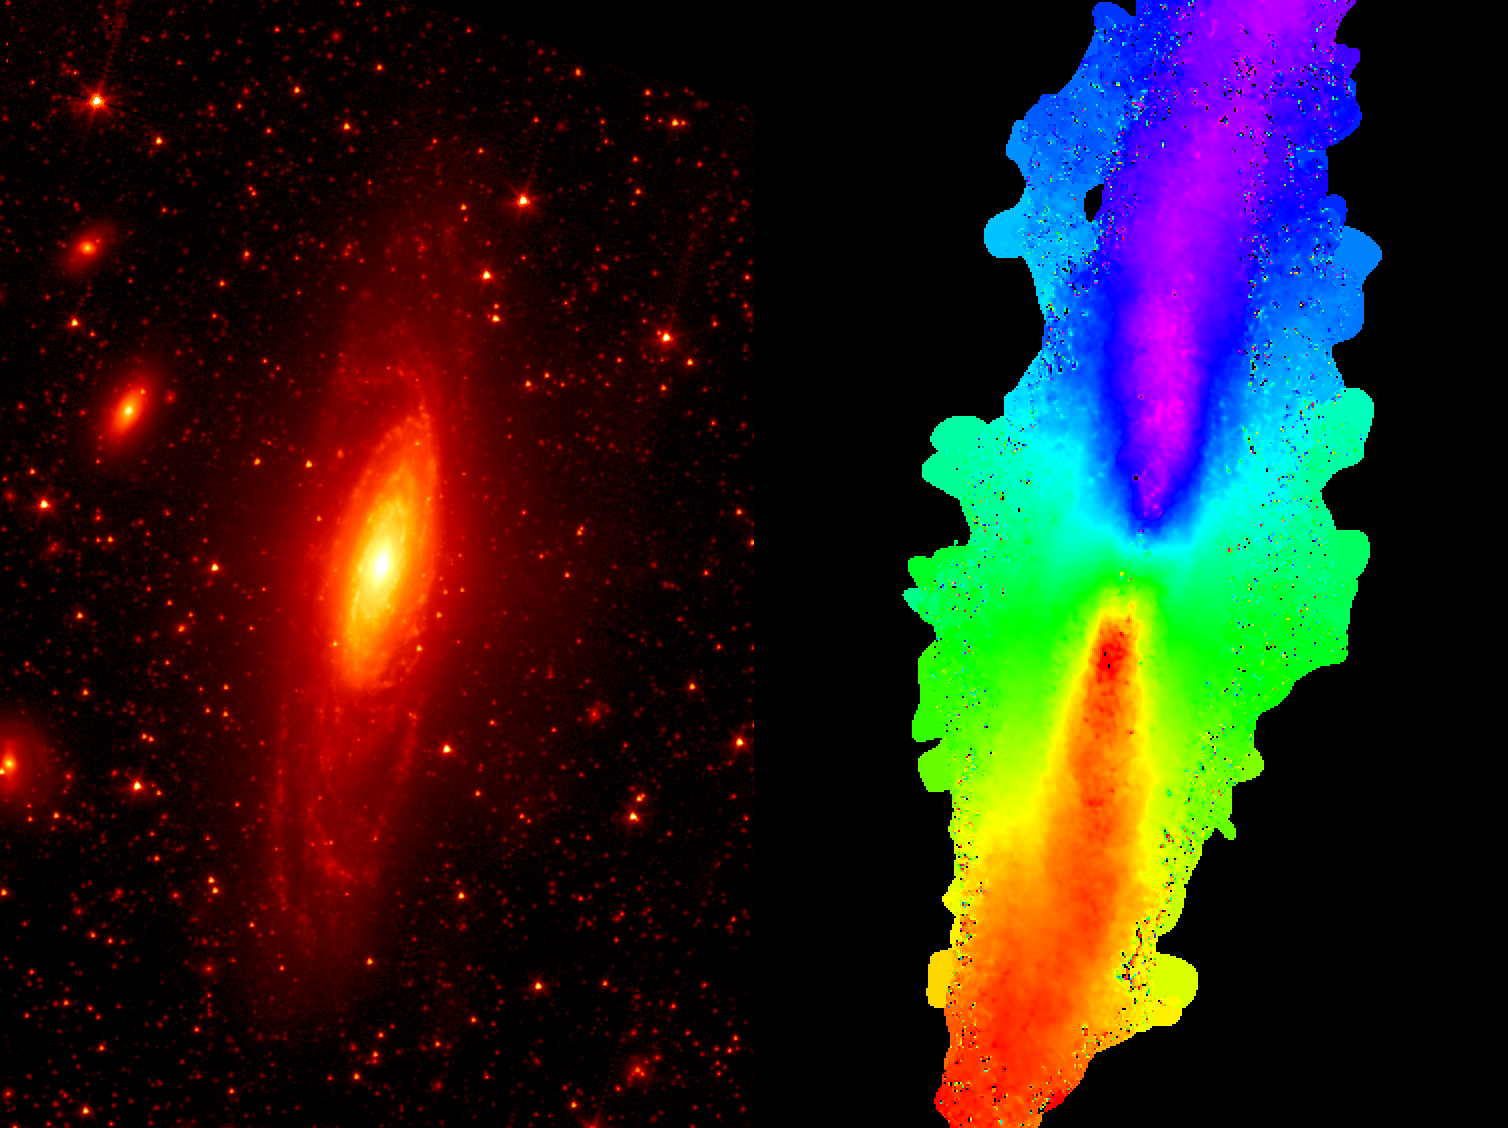
The Tully-Fisher relation states that the luminosity of a galaxy in optical or near-infrared light can be related to the velocity at which gas rotates within the galaxy, as both of these properties are related to the galaxy's mass. Since the measured flux (or apparent brightness) of an object depends on the object's luminosity and distance, this relation is used to measure distances to galaxies. This experiment is based on deriving the Tully-Fisher relation from near-infrared data from the Spitzer Space Telescope and radio data from the Jansky Very Large Array. Using both the distances to galaxies as well as the velocities at which they are moving away from the Earth, it is also possible to derive the Hubble constant.
The image shows two different datasets used in this experiment. The left panel shows the near-infrared emission from stars within the spiral galaxy NGC 7331. The right panel shows the observed velocity of the hydrogen gas that emits at radio wavelengths from that galaxy. The near-infrared image comes from the Spitzer Infrared Nearby Galaxies Survey, and the radio image comes from The HI Nearby Galaxy Survey.
Measuring the Rotation of TW Hydrae
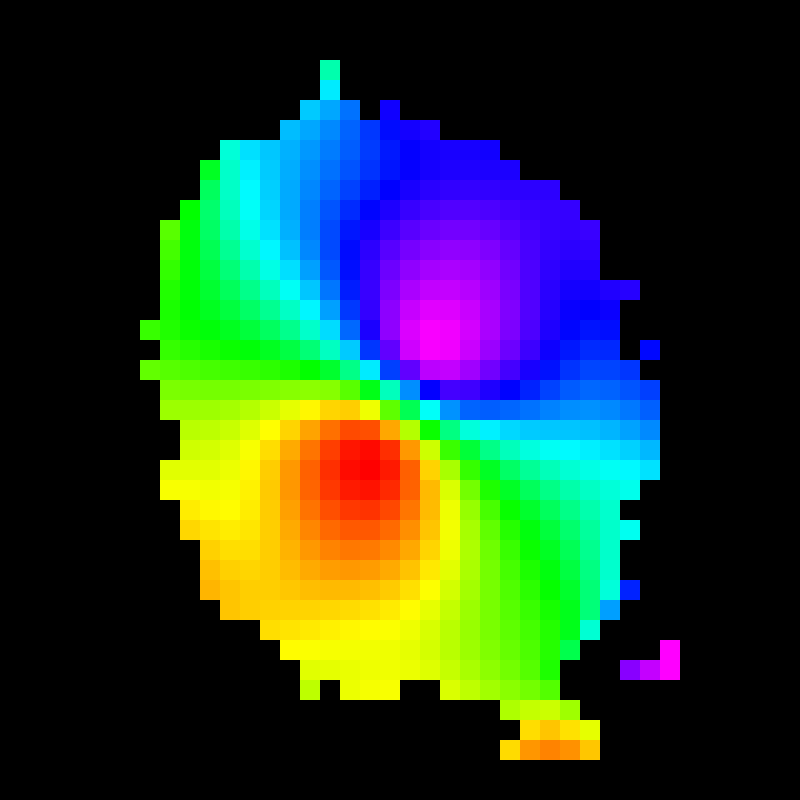
TW Hydrae is a protostellar object consisting of a star forming out of a disk of gas and dust. This experiment describes how, using ALMA observations of spectral line emission from carbon monoxide molecules, it is possible to measure the rotation velocity of the disk and hence determine the mass of the star.
The image here uses colours to show the velocity of the gas in the disk, with red colours showing gas moving away from the Earth and blue colours showing gas moving towards the Earth. This image is based on data from this file, which also contains the data used in the experiment.
The Relation Between Gas Density and Star Formation Rate in the Spiral Galaxy M100
Lab Script (PDF)
Secondary school level (Spanish version)
Lab Script (PDF)
University level
Lab Script (PDF)
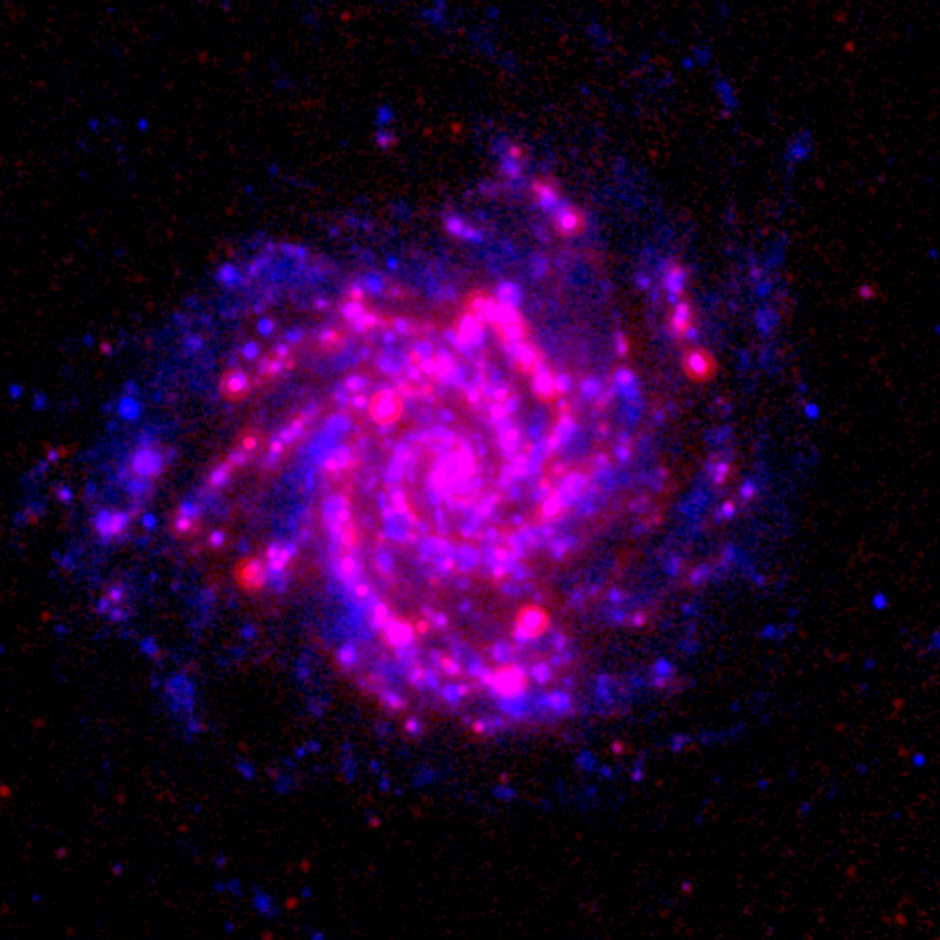
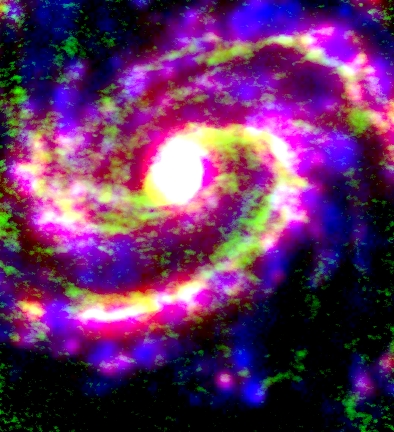
Astronomers have found an important relation between the rate at which stars form and the amount of interstellar molecular gas that is available for forming stars. This experiment provides instructions on how to measure this relation in the center of the spiral galaxy M100.
The multicolour image here shows the data used in this experiment. The near-ultraviolet (2267 Angstrom) emission is shown in blue, the millimeter (2.6 mm) emision is in green, and the mid-infrared (24 micron) emission is in red. The star forming regions appear red, blue, or magenta in this image, while the molecular gas appears green or white. The ultraviolet image was published by M. Brown et al. (2014, ApJS, 212, 18) and can be downloaded from this link. The mid-infrared image is one that I published myself (Bendo et al., 2012, MNRAS, 423, 197) and is available from this link. The millimeter image is available from this ALMA website.