The volume of the element is dxdydz
This applet was developed with JavaView
All three axis x, y and z have the same limits from -1.0 to +1.0 with the origin at the centre of the graph

The volume of the element is dxdydz
The volume element is the transparent red box. The red lines are projections onto the XY, XZ and YZ planes. Annotated onto the graph are the lengths dx, dy and dz slightly offset from the volume element.
In three dimensions it is important to be able to view the scene from different viewpoints

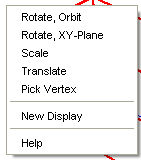
right clicking on the graph will show this menu
The scene can be rotated by selecting one of the rotation options in the menu in the above figure. Then in the graph window hold down the left mouse button and drag. When in orbit mode the scene can be rotated in all directions whilst in plane rotation the scene either rotates about the z-axis (when dragging motion is initaly horizontal) or about the xy plane (when the dragging motion is intially vertical).
If "Scale" is selected from the right click menu then you will be able zoom in and out of the scene. This can achieved by holding the left mouse button down and then dragging. Dragging up or right will zoom in and dragging down or left will zoom out.
"Translate", "Pick Vertex" and "New Display" are not necessary for the use of this program.
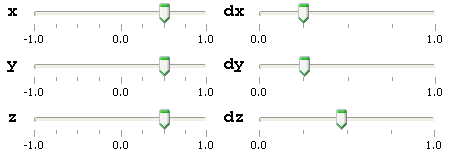
The position and size of the element can be altered by clicking on and dragging the various sliders present at the bottom of the applet. If you choose values too small then the labeling may start to overlap and become hard to discern.

Sliders, what can`t they do!