The area of the element is given by dx*dy
This is a graph that shows a small area element defined in cartesian coordinates
The limits for the graph are from -1 to +1 on both x and y axis with the origin (0, 0) at the centre of the graph.

The area of the element is given by dx*dy
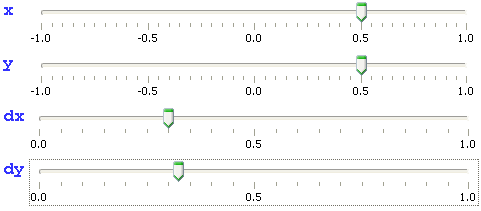
The position and size of the element can be altered by clicking on and dragging the various sliders present at the bottom of the applet.

Sliders ahoy