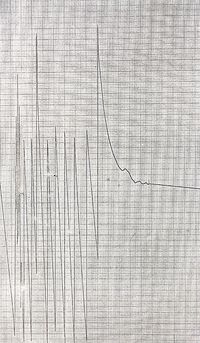
Eagle Lander

This is a chart recording of signals from Apollo 11's Eagle Lander which were picked up at Jodrell Bank. The graph shows time on the horizontal axis and the frequency of the signal being received on the vertical axis. As the relative velocity between the telescope and the Lander changes, the signal being observed is Doppler shifted to higher or lower frequencies. The first half of the graph in which the signal appears to jump up and down is just where the settings on the receiver are being adjusted. In the second half of the graph you can see a smoother signal which then shows several wiggles up and down. These wiggles show where Neil Armstrong took manual control of the Lander to fly it over uneven ground. The signal then becomes a straight line when the Eagle finally lands on the Moon's surface. The slowly changing frequency is then just due to the relative velocity between the telescope and that point on the Moon's surface.
Copyright: ©
Credit: Jodrell Bank Centre for Astrophysics, University of Manchester

