Supplementary Material
to:
An Introduction to Radio Astronomy
4th edition Cambridge University Press 2019
Last updated 24/05/2019
Chapter 17: The Radio Contributions to Cosmology
The Cosmic Microwave Background:
Overview Material
For
an overview of the basics of CMB astrophysics see:
http://background.uchicago.edu/~whu/intermediate/intermediate.html
An extensive collection of
information on CMB-related matters, both ground and space, is the NASA Legacy Archive for Microwave Background Data
Analysis (LAMBDA) site https://lambda.gsfc.nasa.gov/ For an overview of the data products
and other resources available on the site see https://arxiv.org/pdf/1905.08667
This is an overview of the data products and other resources
available through
For an overview of the analysis of CMB data: https://space.mit.edu/home/tegmark/cmb/pipeline.html
The Planck mission
Descriptive ESA animations of the Planck mission can be found at :
Building
up the sky maps: http://sci.esa.int/planck/41071-mapping-the-cosmic-microwave-background/
Peeling
back the foregrounds: http://sci.esa.int/planck/51556-revealing-the-cosmic-microwave-background-with-planck/
Gravitational
lensing of the CMB: http://sci.esa.int/planck/51607-gravitational-lensing-of-the-cosmic-microwave-background-animation/
The scientific papers in
the Planck 2018 release :
are published in a special issue of Astronomy and Astrophysics; the list is at https://www.cosmos.esa.int/web/planck/publications .
The paper “Planck 2018 Results 1:
The Overview and Cosmological Legacy of Planck”
is available at https://arxiv.org/pdf/1807.06205.pdf and gives an up-to-date summary of the main
results. This paper includes
-
all
sky maps at the nine observing frequencies
-
the
final “foreground-subtracted” total intensity map
-
a discussion
of polarisation imagery.
-
statistical
analysis in terms of anisotropy spectra
-
cosmological interpretation
-
references to the other papers in the 2018 release
The
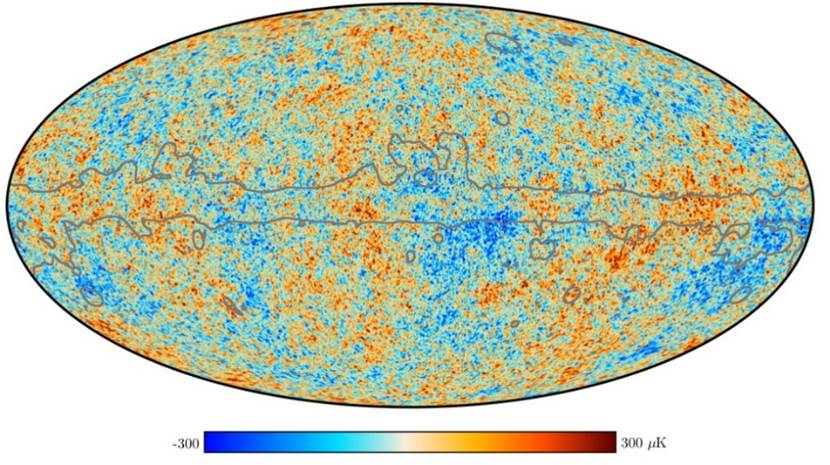
complete set of Planck images can be seen at https://www.cosmos.esa.int/web/planck/picture-gallery. Below we show the Planck
Total Intensity Map. The grey lines around the Galactic plane mark the region
where the foreground subtraction is not as accurate as elsewhere. (image credit: ESA and the Planck
Collaboration)
An
up-to-date collection of plots of the CMB total intensity anisotropy, combining
Planck data with higher angular resolution data from ground based telescopes
(the South Pole Telescope (SPT) and the Atacama Cosmology Telescope (ACT) can be found on the NASA LAMBDA site https://lambda.gsfc.nasa.gov/graphics/
Galactic
Foreground Spectra
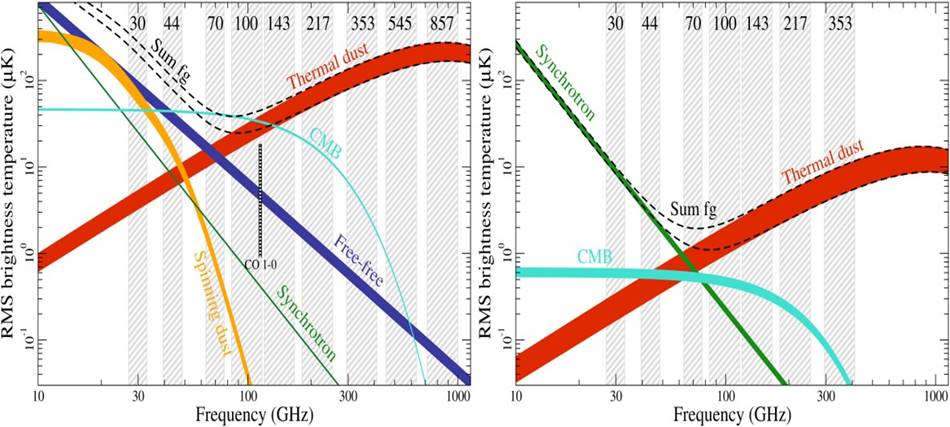
A colour version of Fig 17.3 (main text). See
also the caption of the simplified intensity spectrum in Chapter 14 of Supp.
Mat.
Up-to-date plots of CMB
polarisation results can be found on the NASA
LAMBDA site at https://lambda.gsfc.nasa.gov/graphics/ and a collection of references to current foreground
measurements can be found on the same site
at https://lambda.gsfc.nasa.gov/product/foreground/fg_diffuse.cfm
Polarisation
For
introductions to the phenomenology and physics see:
http://background.uchicago.edu/~whu/intermediate/Polarization/polar5.html
and https://www.cfa.harvard.edu/~cbischoff/cmb/
A
collection of references to current foreground measurements can be found on the NASA
LAMBDA site at https://lambda.gsfc.nasa.gov/product/foreground/fg_pol_survey.cfm
The Sunyaev-Zel’dovich Effect
ESA animation
showing frequency dependence
Fig 17.6 shows how the CMB
spectrum is shifted to higher frequencies by the SZ effect. At frequencies below 218 GHz the result is a
decrement in the CMB intensity whilst above 218 GHz there is an increment. The ESA animation http://sci.esa.int/planck/48231-animation-of-the-sunyaev-zel-dovich-effect/ brings this to life in the context of the Planck mission
Current
measurements
A collection of references to
current measurements can be found on the
NASA LAMBDA site at https://lambda.gsfc.nasa.gov/product/foreground/fg_sz_cluster.cfm
Commentary
article on the astrophysical Importance of galaxy cluster studies
The
article by Rudnick (2018) “The Stormy Life of Galaxy Clusters” https://arxiv.org/ftp/arxiv/papers/1901/1901.09448.pdf, while covering much more ground than
radio studies alone, provides a highly readable, “big picture” overview of the
astrophysical issues associated with clusters of galaxies.
Strong gravitational lenses
eMERLIN /HST image of the first
gravitational lens to be discovered:
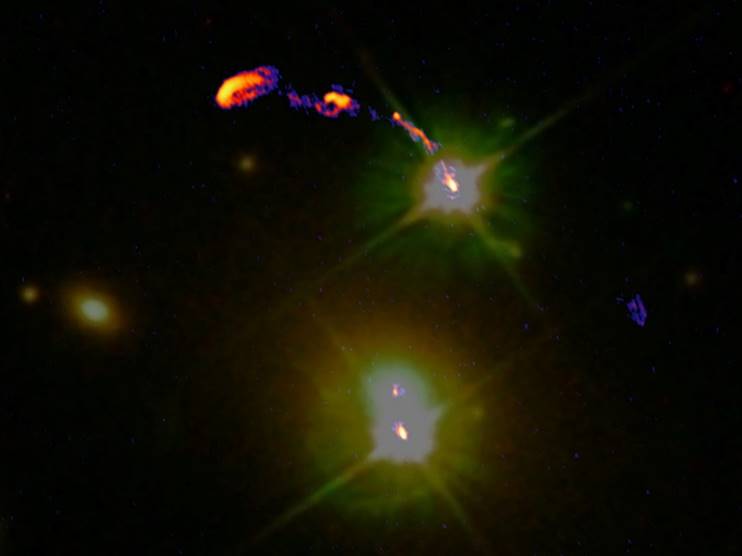
The
so called “Double Quasar” 0957+561A,B was the first
gravitational lens to be identified (Walsh et
al 1979 Nature, 279, 381) from
follow-up observations of the 966 MHz survey carried at Jodrell Bank. Fig 17.8 (main text) shows
radio contour maps of the Double Quasar
at two resolutions. The image above
is a composite of an e-MERLIN radio image of the Double Quasar and an earlier
Hubble Space Telescope (HST) optical image. One of the lensed quasar core
images is visible at lower right. The radio emission generated by the black
hole as seen with e-MERLIN is visible as the compact bright region superimposed
on the (yellow-green) optical emission seen by HST. The radio jet, moving at
speeds approaching that of light, is seen in the e-MERLIN image arcing away
from the black hole towards the upper left. The jet shows several regions of
enhanced brightness before it ends in a hotspot where it is ploughing through
the tenuous matter filling the space around the quasar. The e-MERLIN image is
shown in false-colour with a colour table ranging from blue through red to
white, where the colours represent the brightness of the radio emission. The
HST image is made from WFPC2 images through two filters: the F555W filter
(V-band) is coloured green and the F814W filter (I-band) is coloured red.
Image
and Text Credit: Jodrell Bank Centre for Astrophysics, University of Manchester – see http://www.jb.man.ac.uk/news/2010/emerlin1/
A VLBI
image of an extended lensed arc:
A
superb high resolution VLBI image of the CLASS lens 1938+666 (see JVAS/CLASS
survey entry below) showing extended lensed arcs of emission can be found in
the presentation by J. McKean et al. :
http://evn2014.oa-cagliari.inaf.it/EVN2014/Talks/01%20Tue%20Morning/McKean_EVN2014.pdf
and the
paper by C. Spingola et al: (2019) https://arxiv.org/abs/1902.07046.
An ALMA
lens image:
With
its sensitivity to dusty galaxies at high redshift ALMA is proving to be a
powerful new tool for the study of gravitational lensing – a recent example is https://arxiv.org/abs/1707.00702
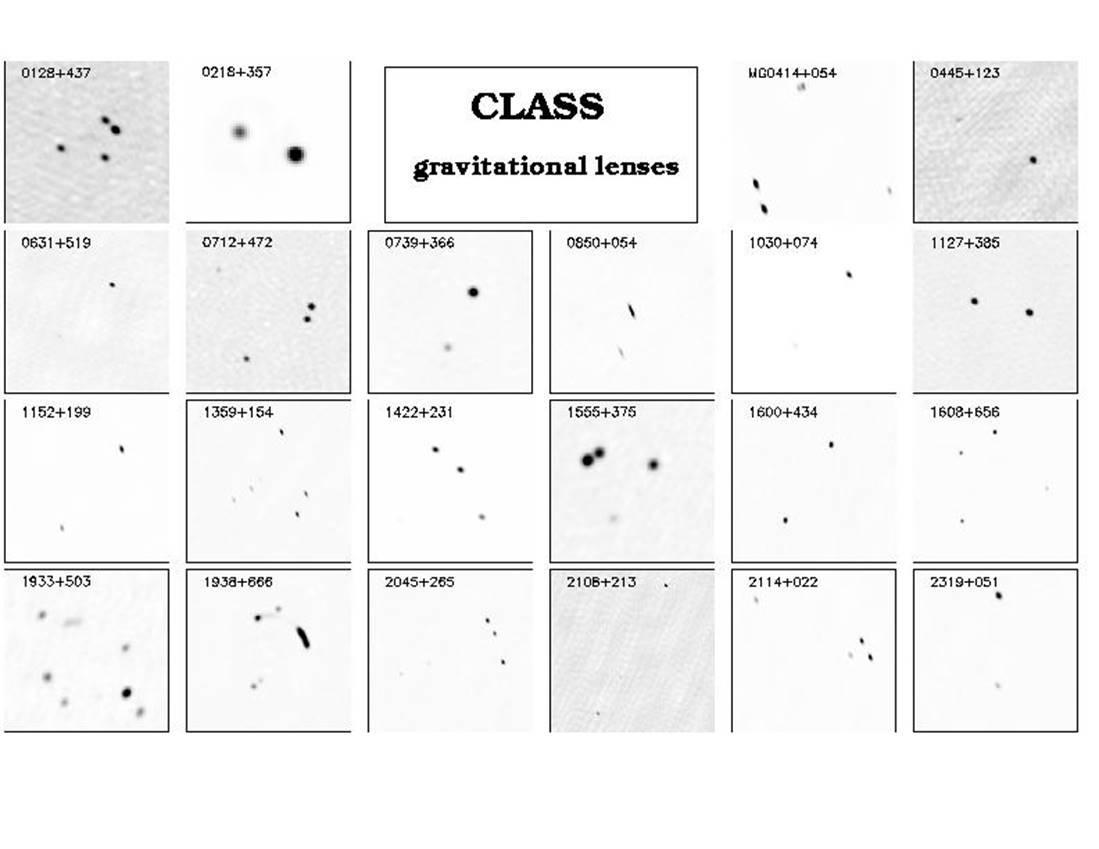
The JVAS/CLASS survey:
Currently
the only complete survey for strong
gravitational lenses was carried out with the VLA at X-band by the JVAS/CLASS
collaboration
http://www.jb.man.ac.uk/research/gravlens/class/class.html
The
individual JVAS/CLASS images and related discussion on each lensed system can
be found http://www.jb.man.ac.uk/research/gravlens/lensarch/lens.html
Lens time
delays and Ho: (entry composed
with A. Biggs, ESO Garching)
Determining
the time delay between lensed images provides a direct route to the
determination of the Hubble constant. Detailed
descriptions of the analysis techniques can be found in the papers by A. Biggs
and I.W.A. Browne 2018,
MNRAS, 476, 5393 (https://arxiv.org/pdf/1802.10088.pdf ) and C. Fassnacht
et al., 2002, ApJ, 581, 823. As of January 2019
there are seven radio lens systems with published time delays:
|
Source |
Radio
time delay (days) |
Reference |
|
JVAS B0218+357 |
11.3 ± 0.2 |
Biggs & Browne, 2018, MNRAS, 476, 5393 |
|
B0957+561
|
409
± 30 |
Haarsma
et al. 1999, ApJ,510, 64 |
|
JVAS B1030+074 |
146 ± 6 |
Biggs, 2018, MNRAS, 481, 1000 |
|
JVAS B1422+231 (multiple
images cf. one of them) |
1.5
± 1.4 7.6
± 2.5 8.2
± 2.0 |
Patnaik & Narasimha, 2001, MNRAS, 326, 1403 (detections
have low signal-to-noise ratios in some cases) |
|
CLASS B1600+434 |
47 ± 6 |
Koopmans et al., 2000, A&A, 356, 391 |
|
CLASS B1608+656 (multiple
images cf. one of them) |
31.5
± 1.5 36.0 ± 1.5 77.0 ± 1.5 |
Fassnacht et al., 2002, ApJ, 581,
823 |
|
PKS 1830-211
|
26
± 4.5 24
± 4.5 |
Lovell et al., 1998, ApJ,
501, L51; Wiklind & Combes, 2001, ASP Conf. Series, Vol. 237, p. 155 |
Notes: 1) All the determinations
were made with the VLA, except for PKS 1830-211 which used the Australia
Telescope Compact Array (ATCA; Lovell et
al, 1998) and the Swedish-ESO sub-millimetre Telescope (SEST; Wiklind & Combes, 2001).
2)
B0957+561 is the original “Double Quasar” – see the eMERLIN/HST
image above. An optically derived delay of 422.6 ±
0.6 days is given by Oscoz et al., 2001, ApJ, 552, 81 who, however,
discuss how the published delays fall into short and long values (417d and
425d).
3) The time delay for B1422+231
has significant uncertainty and differs from values expected from a model
(Raychaudury et al., 2003, AJ, 126, 29).
To derive values of the Hubble
constant one requires both accurate time delays and reliable mass models –
Jackson (2015) (see https://link.springer.com/article/10.1007%2Flrr-2015-2)
discusses the challenges. Currently of
the lenses with accurate delays the most useful for Ho purposes are B0218+357
and B1608+656 and only values for those are listed below.
|
Source |
Ho km/s/Mpc |
Comments |
|
JVAS B0218+357 |
72.9
± 2.6 |
Good modelling constraints
(Einstein ring) |
|
B0957+561
|
|
Modelling difficult
due to cluster |
|
JVAS B1030+074 |
|
Few lensing
constraints (double) and possibly two lensing galaxies |
|
CLASS B1600+434 |
|
Few constraints
(double) and a secondary lensing galaxy |
|
CLASS B1608+656 |
70.6 ± 3.1 |
Good constraints (a
quadruple lens) and the model has received a lot of attention (e.g. Suyu et al.,
2010, ApJ, 711, 201) |
|
PKS 1830-211
|
|
Potentially has very good constraints (Einstein
ring) but there is uncertainty over the lens position and there is a
perturbing galaxy at lower redshift. More observations and modelling required. |