Supplementary Material
to:
An Introduction to Radio Astronomy
4th edition Cambridge University Press 2019
Last updated 04/12/2021
Chapter
16 Active
Galaxies
Starburst Galaxies
M82 and its supernovae
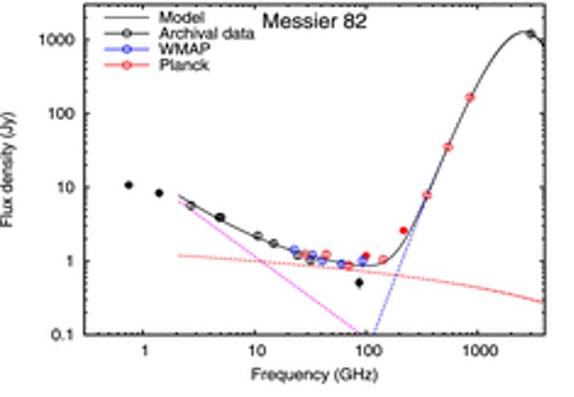
Radio and infra-red
spectrum of the nearby (distance 3.5 Mpc) starburst galaxy M82 (this is a replacement for Fig
16.2 - see Errata on opening page):
The dotted lines represent emission
from different radiation mechanisms:
·
cyan: synchtrotron
·
red: free-free
·
blue: thermal
Figure from Peel et al
2011 MNRAS 416, L99 with permission.
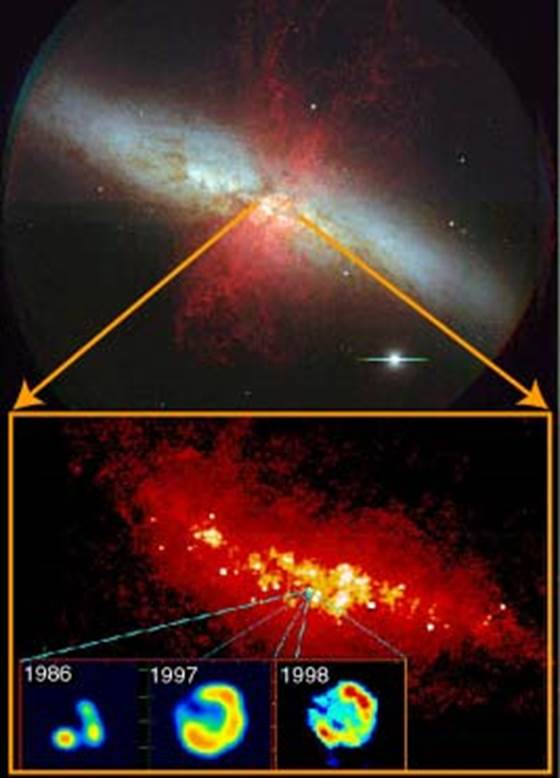
Images of the starburst galaxy M82: top) an
optical image, taken with the Subaru telescope, of the nearby starburst galaxy
M82; bottom) a MERLIN/VLA radio image of the very central regions (~500 pc) of
the galaxy. The optical image shows hydrogen gas (red) being flung out in
directions above and below the main disc of the galaxy. The radio waves see
through to the dust enshrouded core and reveal a population of very young
supernova remnants (the bright points in this image); the inset shows how one
of them has expanded over a decade or so. It is this high rate of supernova
explosions which drives the galactic wind seen in the optical image. (image and
text from http://www.jb.man.ac.uk/distance/radio/course/sourcesII/sourcesII5.html).
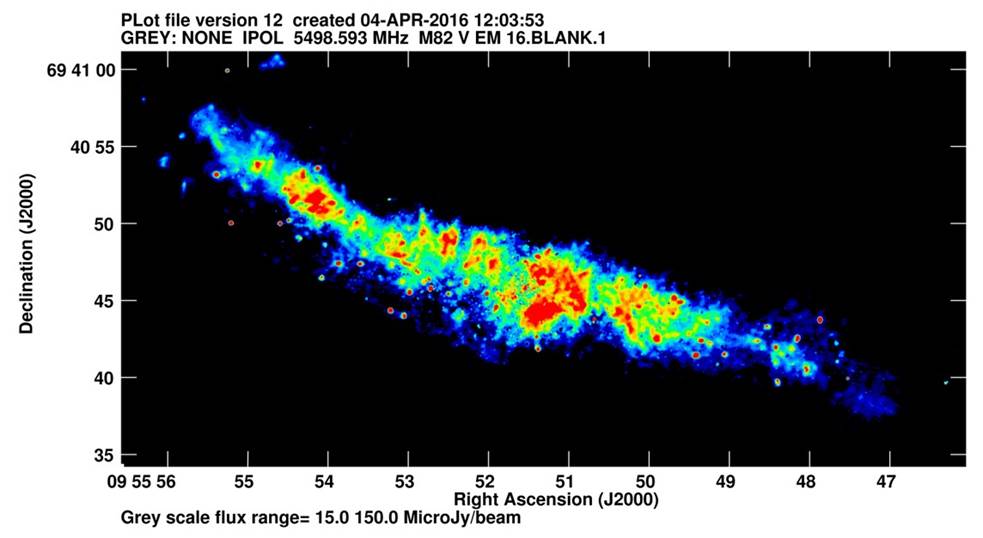
M82 at higher angular resolution.
This false colour radio image has a higher
resolution (100 milliarsec) was made from a combination of data from
eMERLIN and the JVLA at C-Band (~5 GHz). These images
complement Fig 13.8 and Fig 16.1 in the main text. (Image
credit: Tom Muxlow)
Arp 220 and its supernovae
Another much studied starburst
galaxy is Arp 220 at a distance 76 Mpc. Its supernova
rate is ten times higher than M82 (see e.g. Lonsdale et al 2006 ApJ, 647, No 1; see also https://arxiv.org/abs/astro-ph/0604570). A further representation of the Arp220 as a “supernova
factory” can be seen at https://www.flickr.com/photos/onsala/6194194999
Active
Galactic Nuclei (AGN):
Review papers
on central engines and relativistic jets
We recommend the conference introduction paper “Black
Holes as Cosmic Dynamos” by Roger Blandford
https://arxiv.org/pdf/1901.05164.pdf which provides accessible additions to the
discussion of “central engines” in Chapter 16. For a fuller research-level discussion we
recommend the extensive illustrated review “Relativistic Jets in Active
Galactic Nuclei” by R.D. Blandford, D.
M. Meier and
A.C.S Readhead in Ann Rev. Astro. Astrophys 2018 – see also
https://arxiv.org/pdf/1812.06025.pdf.)
Extended double radio sources
Thousands
of images of extended radio sources associated with AGN have been made – in
particular with the NRAO VLA/JVLA. As
noted in the text a good place to start is “An Atlas of DRAGNs” compiled and maintained by P.
Leahy, A. Bridle and R. Strom http://www.jb.man.ac.uk/atlas/. Another rich source of material is the
NRAO Image Gallery http://images.nrao.edu/ and the NRAO Public Gallery https://public.nrao.edu/gallery/. Here we show just a few illustrative examples.
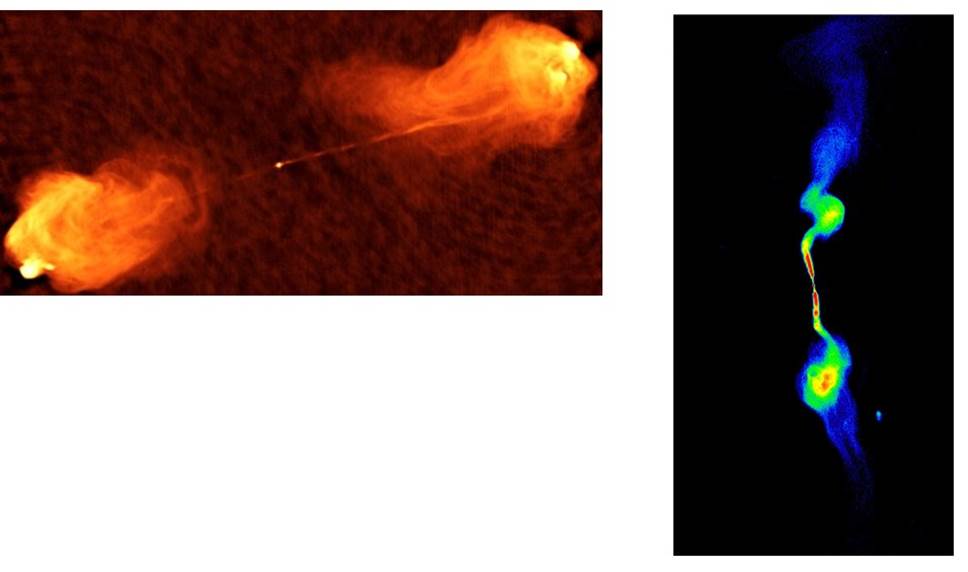
Left) an FRII source: The classic example of FRII morphology
is the radio galaxy Cygnus A. This is a false colour representation of the gray-scale image (shown in Fig 16.4) by Perley et al., 1984 (Image credit NRAO/AUI)
Right) An FRI source: This
is a false-colour VLA image of the source 3C449 shown in Fig 16.5; here the
source is shown in its correct orientation on the sky (image courtesy of Robert Laing).
Imaging the AGN Torus in Cygnus A
Carilli et al (2019) https://arxiv.org/pdf/1904.01365.pdf have produced
direct multi-frequency imaging with the VLA which strongly supports the picture
of the central regions of an FRII radio source (section 16.5). In particular
the images reveal a well-resolved elongated structure centred on the core and
perpendicular to the radio jets whose spectrum is consistent with thermal
free-free emission. Their interpretation
is that the images show the outer parts of the inner circumnuclear torus.
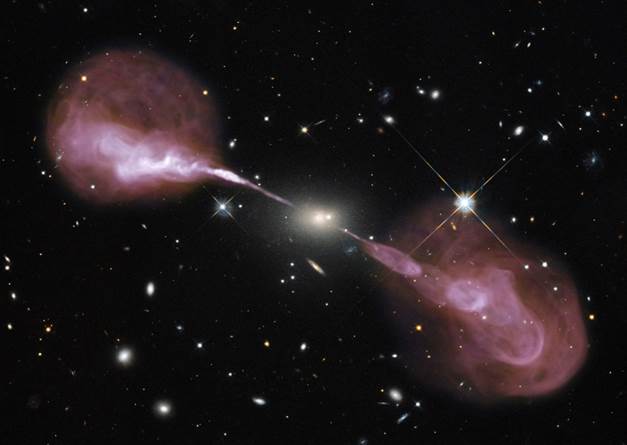
An
extended double radio galaxy: (see https://public.nrao.edu/gallery/hercules-a/). This superb
image of the radio galaxy Hercules A was obtained with a combination of JVLA
data from different arrays – see the entry under Chapter 10 of this Supplementary
Material. (Credit:
NASA, ESA, S. Baum and C. O'Dea (RIT), R. Perley and
W. Cotton (NRAO/AUI/NSF) and the Hubble Heritage Team (STScI/AURA).
For a
multiwavelength view of Hercules A see http://hubblesite.org/news_release/news/2012-47.
Polarisation structure
of an extended jet:
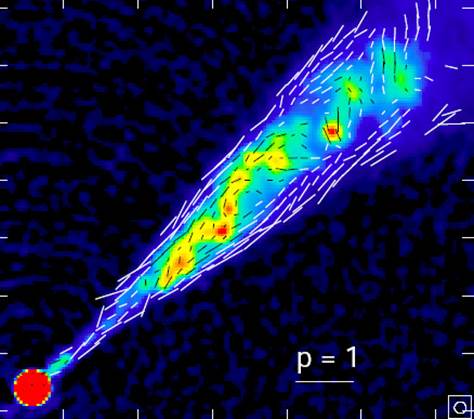
The jet in the FRI radio galaxy NGC315 mapped with the VLA; the linear polarization “vectors” indicate the direction of the magnetic field. The innermost portions of the jets are asymmetrical but on larger (kpc) scales the jets become symmetrical as the outward flow decelerates. For the astrophysical interpretation of the polarisation pattern see Worrall et al. 2007, MNRAS, 380, 2 (image courtesy of Robert Laing).
The inner jet in M87:
[Colour versions of Fig 16.9 in the main text – see section 16.3.3.]
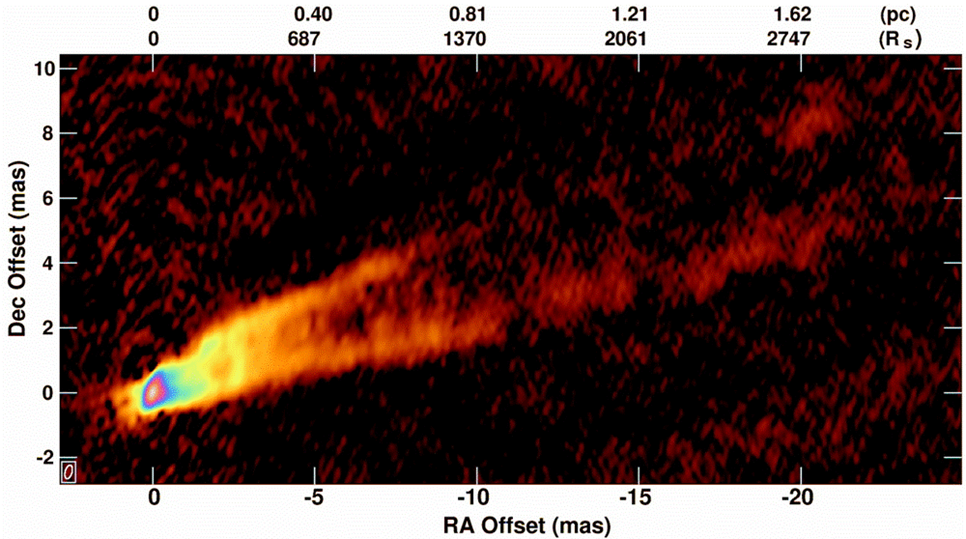
The
first 25 mas of the M87 jet imagesd with the VLBA at 43 GHz https://www.aoc.nrao.edu/~cwalker/M87/ many other images and several movies of the
variations in the jet over many years can be seen at this site (courtesy R.C. Walker)
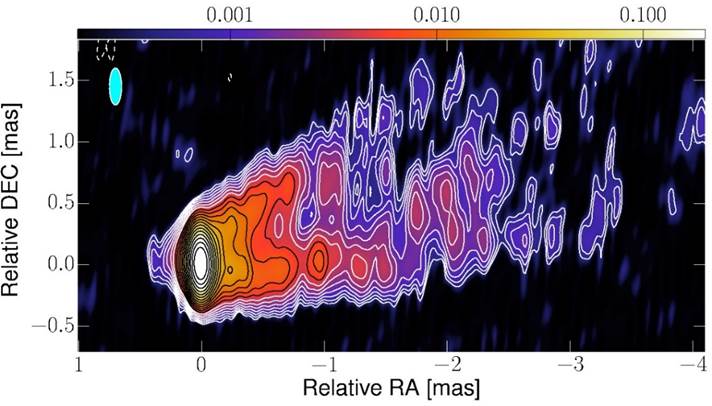
The
inner 3 mas of the M87 jet imaged with the GMVA at 86 GHz. (courtesy J-Y Kim and T. Krichbaum)
The supermassive black
hole in the nucleus of M87
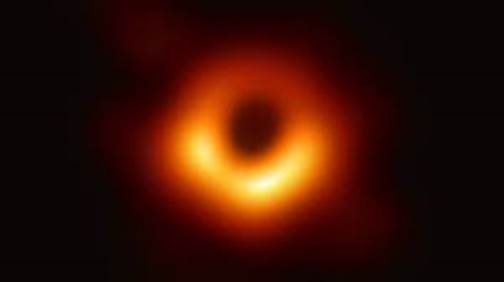
VLBI observations with the Event Horizon Telescope (see
Section 11.4.11 and Supp Mat Chapter 11)
have unequivocally revealed the
“shadow” of a 6 x 10⁹ solar mass black hole in the nucleus of
the giant elliptical galaxy M87. The full scientific story (in 6 papers) can be
followed starting from S. Doelman’s introduction at https://iopscience.iop.org/journal/2041-8205/page/Focus_on_EHT. The multi-faceted and exhaustive
approach to creating the final image is explained in paper IV of the series.
The reader of the text (Chapters 9 and 10) and this Supplementary Material (Chapters
9 and 10) will be able to follow much of the discussion in respect of the u,v coverage, the calibration of the visibility data; the
general discussion of and modelling of the data; the use of closure phase and
CLEAN in the imaging process; the importance of blind tests in establishing
image credibility. The team also used a non-Fourier based approach to image
formation which we have not discussed.
The similarity of the results from independent methods and imaging teams
gives great credence to the overall final composite image. (Image credit Event Horizon Consortium)
Interaction of radio lobes
with hot intra-cluster gas
Fig
16.22 (main text) shows that the extended radio source Hercules A expands
outwards through the hot X-ray emitting gas confined within a cluster of
galaxies. Fig 16.22 establishes the
principle but does not show
details of the effect which the passage of the radio jets+lobes have on the hot cluster gas. The Chandra X-ray
images of the Perseus cluster http://www-xray.ast.cam.ac.uk/papers/per_200ks.pdf
(discussed in A.C. Fabian et al MNRAS 344, L43 (2003)) show shocks and ripples driven by the
expanding radio lobes of Perseus A (3C84). The article “Observational Evidence for AGN
Feedback” by A.C. Fabian https://arxiv.org/pdf/1204.4114.pdf has an up to date discussion of the
relevant physics and a compilation of
images showing radio/X-ray interactions
in the Perseus cluster and around M87.
Faint Radio Sources
Radio Quiet AGN
The
origin of the radio emission from radio quiet AGN (Section 16.7) remains, to an
extent, controversial. A recent review of the issues and potential mechanisms has been
given by Panessa et
al (2019) https://arxiv.org/abs/1902.05917
Faint sources the GOODS-North field
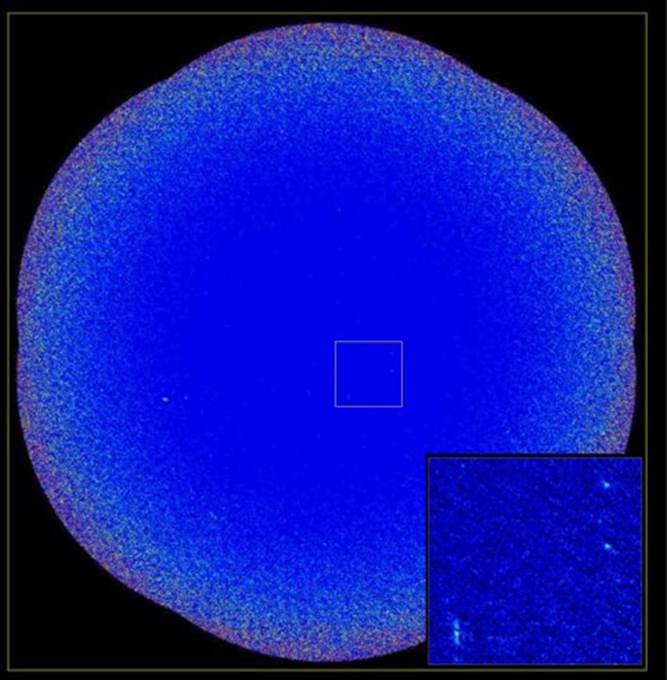
Mosaicing (see
section 11.5) extends the field-of-view of the primary antenna beam by combining
a number of individual pointing centres - this is important for interferometric
surveys of faint sources. The above
figure shows a mosaiced image made with the VLA at 5.5 GHz
using the pointing strategy described with the diagram in Supp. Mat. Chapter 11;
the outer perimeter (diameter ~16.6 arcmin) traces the edges of the hexagonal
pattern of beams clustered around the central one. The overall field is
corrected for the primary beam response at each pointing in order correctly to recover the source flux densities across the
mosaic - this process has the effect of raising the noise levels towards the
edge of the mosaic whilst maintaining a flat sensitivity response across the central
region and most of the field. The
inset shows some faint (sub-milliJy) sources within
the square outlined near the image centre. These data form part of the e-MERGE
project (Muxlow et
al., in preparation) which
focusses on faint radio sources in the well-studied GOODS-N field (courtesy T. Muxlow).
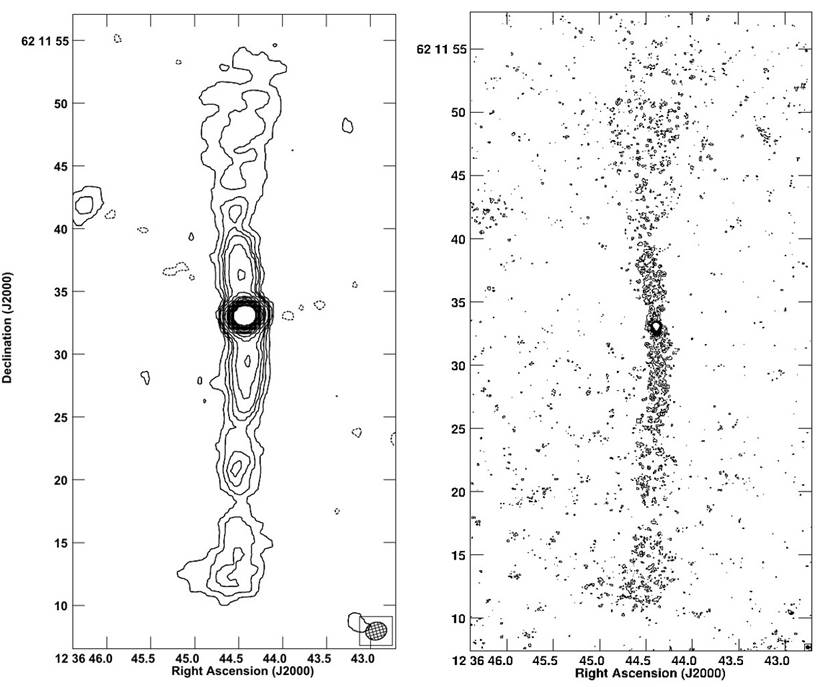
The left hand
contour plot above shows a JVLA image at L-band
(centre frequency 1.5 GHz) of the strongest source in the
mosaiced 5.5 GHz JVLA image above;
the beam is 1.68x1.40 arcsec and the rms noise is 2.04 microJy/beam. The right hand contour plot
shows the same source made with a combination of JVLA+eMERLIN
data in which the resolution is 0.28 x 0.26 arcsec; the bottom contour is plotted at
3 microJy/beam and the total flux density is 1.29 milliJy.
The JVLA image reveals a low surface
brightness double-lobed structure characteristic of an FRI source; the addition
of e-MERLIN data increases the angular resolution and sensitivity and reveals fine
detail in the region of the inner south-pointing jet and core. The core has a
peak brightness of 501 microJy/beam and
is coincident
with an I=21.6mag elliptical galaxy at a redshift of 1.0128. In the high
resolution image the outer lobes are well resolved and do
not contain any significant compact radio structure such as outer “hot-spots”.
The deepest e-MERGE images are obtained by combining
L-band JVLA and e-MERLIN data at 1.5 GHz. In the first data release (DR1) images the rms noise is ~1.2 microJy/beam and
hence 5s detections of unresolved
sources can be made at a flux density of ~6 microJy. (In the second data release (DR2) the rms
noise level will decrease to ~0.6 microJy/beam).
With the DR1 data approximately 850 sources have been detected within a 15
arcmin diameter field in GOODS-N. Previous studies (see section 16.9.4) have
shown that the percentage of starburst systems in faint source samples
increases with decreasing flux density; below 100 μJy
at 1.4 GHz >70% of the sources are starburst-type associated with major disc
galaxies with redshifts 0.3−1.3. The
e-MERGE observations confirm this trend down to ∼ 10 microJy and show that many luminous star-forming systems
exhibit bright nuclear starbursts embedded within regions of extended
star-formation. In addition the radio emission from a
significant number of radio-quiet AGN (identified by AGN activity in other
wavebands) is dominated at radio wavelengths by star-formation (Muxlow et al., in preparation) (images and text courtesy T. Muxlow).
Source counts at faint
flux levels:
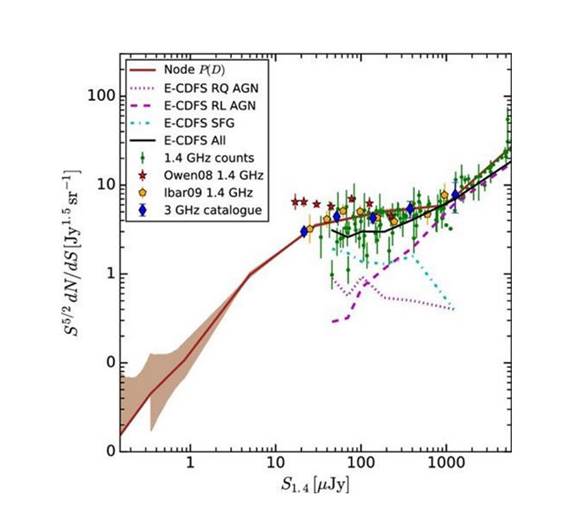
Euclidean-normalized source counts scaled to 1.4 GHz from Vernstrom et al (2016). The brown solid line is their P(D) count with the shaded area being the 68 per cent confidence region. For further discussion of this diagram see Vernstrom et al 2016 MNRAS, 462, 2934 (Fig 8; panel b) (also available https://arxiv.org/abs/1603.03085).
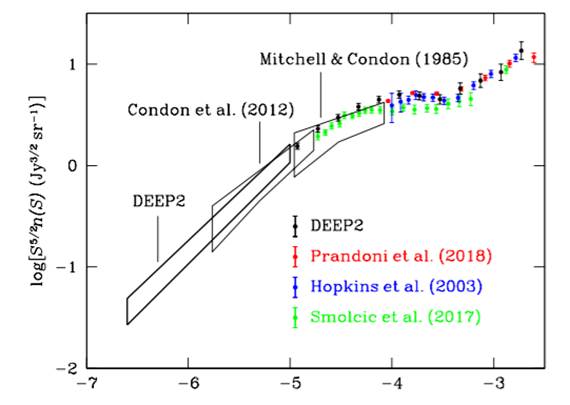
The MeerKAT 1.28 GHz DEEP-2 image by
T. Mauch et al Astrophysical Journal vol 888, 61 (2020)
currently provides the deepest source counts translated to 1.4 GHz. These results are discussed in a wider
context by Matthews et al https://arxiv.org/pdf/2101.07827.pdf.
Prandoni (2018) https://arxiv.org/pdf/1806.10886.pdf also provides a concise overview of the faint source counts and their implications.
The MWA GLEAM survey counts at 88-200 MHz and the
challenges posed by sidelobes when using phased arrays are discussed by Franzen
et al (2018) https://arxiv.org/abs/1812.00666
Surveys for faint radio
sources
There
are several wide-area deep-field surveys for discrete radio sources currently
(2018) underway. Examples are:
At low frequencies:
·
The
GLEAM survey with the MWA: see the
following paper and references therein
https://arxiv.org/abs/1812.00666
·
The
LOFAR Two-metre Sky Survey (LoTSS;
T.W. Shimwell et
al., A&A,
598, A104, (2017)) is imaging the Northern Sky in the band 120-168 MHz: for an
illustrated overview of LoTSS see http://www.astron.nl/LifeCycle2018/Documents/Talks_Session1/Williams_LifeCycle18.pdf also at https://www.lofar-surveys.org/. At the time of writing (April 2019) the
survey is 35% complete; it will be completed in ~2024.
At mid-radio frequencies
· The ASKAP 1.3 GHz Evolutionary Map of the Universe (EMU) survey (see http://emu-survey.org/ and https://arxiv.org/pdf/1106.3219.pdf) will cover declination from -90 to +30 degrees at a frequency of 995 MHz and will reach an order of magnitude deeper than the VLA NVSS survey. The enormous number of sources expected to be detected (>5 x 10⁷) means that machine learning techniques will be vital for digesting the data.
· The 3-GHz VLA Sky Survey (VLASS https://public.nrao.edu/vlass/ and https://science.nrao.edu/science/surveys/vlass is well underway and the first science papers have been
published.
In the (redshifted) 21cm line
· The ASKAP WALLABY survey http://www.atnf.csiro.au/research/WALLABY/ is
aimed at detecting the HI emission from galaxies out to z~0.25.
· The WSRT APERTIF surveys https://www.astron.nl/radio-observatory/apertif-surveys
· The MeerKAT LADUMA
survey: http://www.laduma.uct.ac.za/
Sky simulations for the SKA era
The Tiered Radio Extragalactic Continuum Simulation (T-RECS) https://arxiv.org/abs/1805.05222 (Bonaldi et al 2018) is a new simulation of the continuum radio sky in the frequency range 150 MHz to 20 GHz which models both radio loud and radio quiet AGNs and SFGs. It essentially supersedes the SKADS simulations of Wilman, et al., MNRAS, 388, 1335 (2008) referred to in Section 16.9.3. T-RECS forms the basis of several of the SKA simulated data challenges.