Supplementary Material
to:
An Introduction to Radio Astronomy
4th edition Cambridge University Press 2019
Last updated 04/12/2021
Chapter 15: Pulsars
IRA4 Chapter 15 gives a concise account of this rapidly-growing subject; more details may be found in Pulsar Astronomy by Andrew Lyne and Francis Graham-Smith , Cambridge University Press 4thedn 2012. See also Pulsar Astrophysics: the Next 50 Years, IAU Symp. 337, 2017.
The discovery of
pulsars.
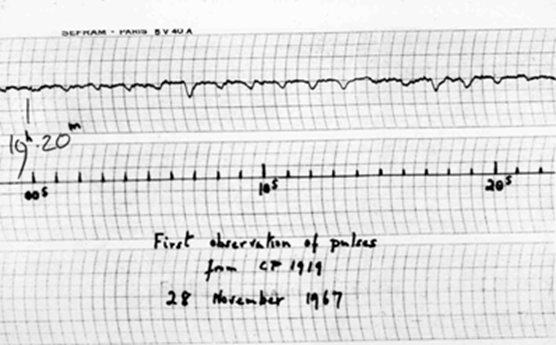
The plot above shows first recording of PSR B1919+21. The periodic nature of the signal appeared in the fast chart recording.
The sounds of pulsars
The pulse
trains of some well-known pulsars are shown along with audio clips can be found
at: http://www.jb.man.ac.uk/research/pulsar/Education/Sounds/
Positions of pulsars
and MSPs in Galactic coordinates.
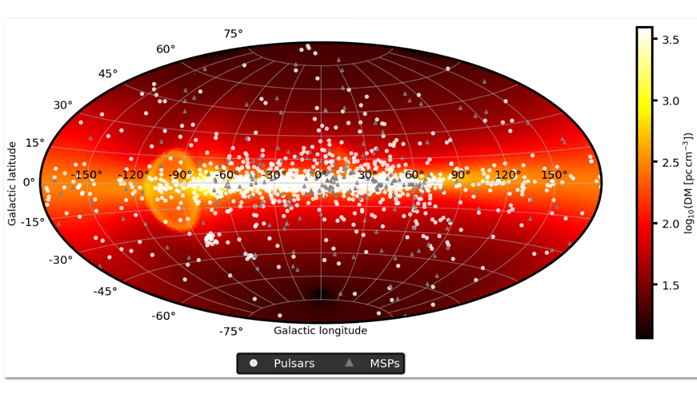
The pulsars and MSPs are from the ATNF
pulsar catalogue (Hobbs et al. 2004; http://www.atnf.csiro.au/people/pulsar/psrcat/),
and have been classified as pulsars or MSPs according to the catalogue. The
background colour scale shows the Galactic electron content as Dispersion
Measure (DM) according to the YMW16 model (Yao, Manchester & Wang, 2017).
As well as the Galactic plane, some other noticeable features in DM are the
large ellipse of the Gum Nebula (centred at l=96o, b=-4o and the
tangential line of sight down the Carina Arm of the Milky Way at l=-75o
to -60o, b=0o.
Compiled by L.N.Driessen,
JBCA.
The P/Pdot
diagram
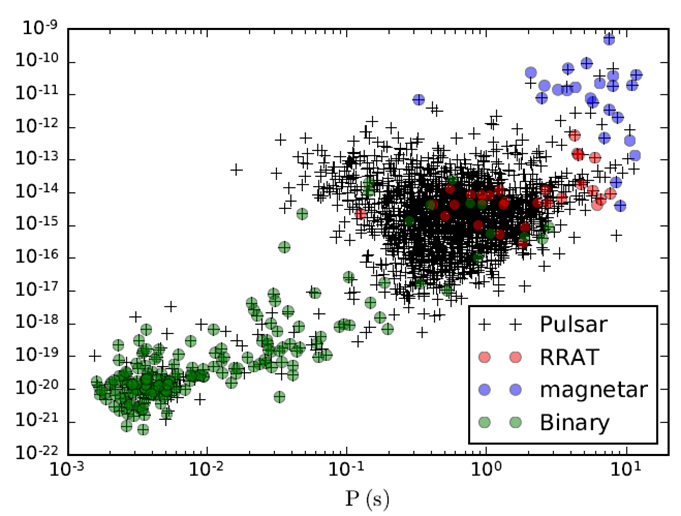
The
diagram above shows all pulsars, RRATs, magnetars and x-ray binaries known at
October 2018 (compiled by C.Walker,
JBCA).. The data are from the pulsar catalogue
http://www.atnf.csiro.au/research/pulsar/psrcat/,
cross-referenced
against the RRAT catalog
http://astro.phys.wvu.edu/rratalog/
and the
magnetar catalog
www.physics.mcgill.ca/~pulsar/magnetar/main.html.
Pulsar Spectra
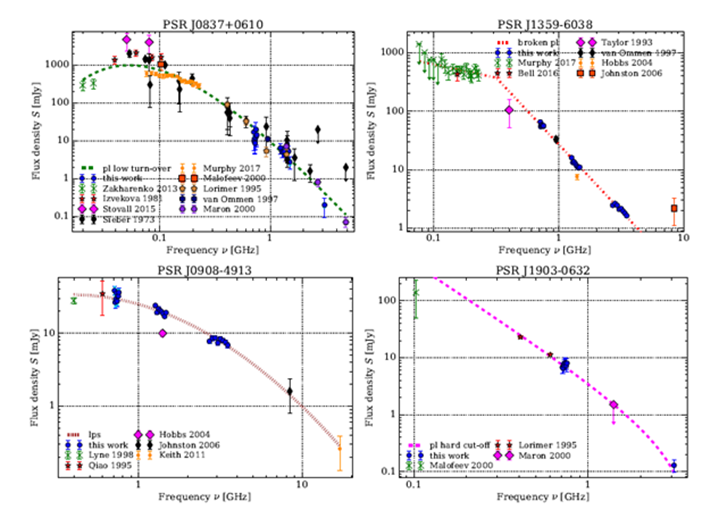
Typical
spectra selected from a compilation by Jankowski et al 2018 MNRAS 473, 4436
The Crab Nebula
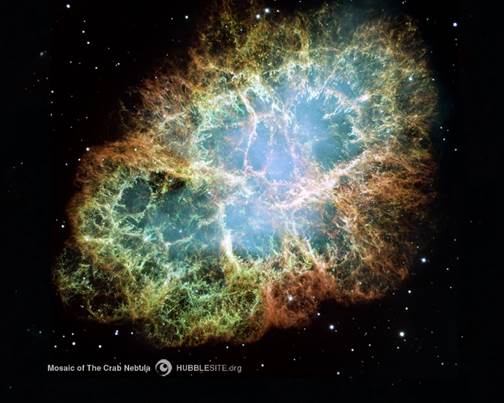
A Hubble Space Telescope image. The whole nebula is expanding from an origin in a supernova in 1054. Details near the centre change on a timescale of months, revealing the location of the pulsar. The filled, as opposed to shell-like, nature of the nebula classes it as a “plerion” or pulsar wind nebula (see below and Safi-Harb (2012) https://arxiv.org/pdf/1210.5406.pdf)
Pulsar Wind Nebulae:
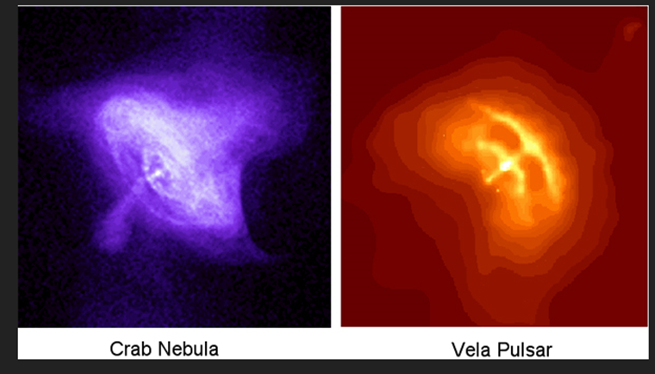
The nebulae close to two pulsars, imaged by the Chandra Xray satellite. The excitation of the nebula occurs through well-collimated jets along the rotation axis of the pulsar. See a review of Pulsar Wind Nebulae by Gaensler and Slade 2006 ARAA 44 17
Bow Shocks
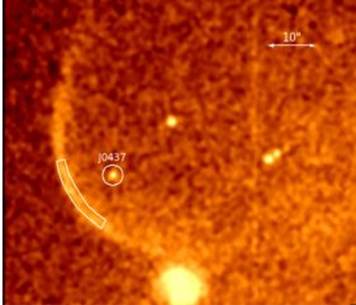
A pulsar moving
with hypersonic velocity can create a bow shock in the surrounding ISM. Left:
Bow shock ahead of 0437.
, observed both in X-rays and in H alpha . Brownsberger
and Romani 2014
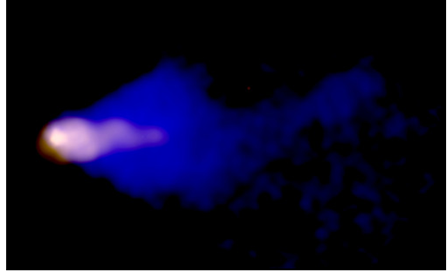
Ap J 784: 154 Right: the head of the Mouse Nebula,
combining observations by the VLA (blue) and Chandra X-ray (gold) Image courtesy of NRAO/AUI and
Chandra: ASA/CXC/SAO/B.Gaensler et al. See a review by Kargaltsev et al 2017 J Plasma Phys. 83 635830501
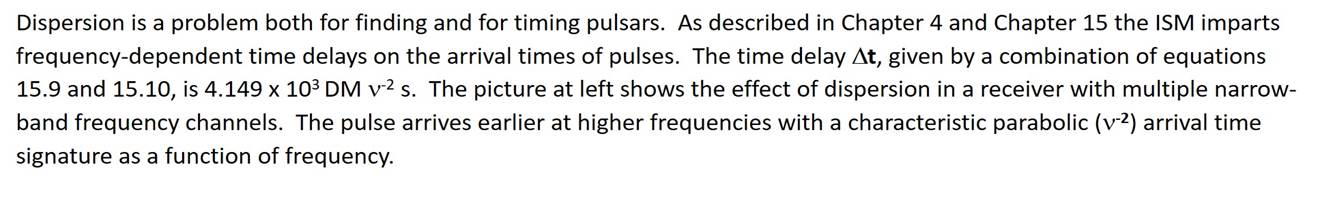
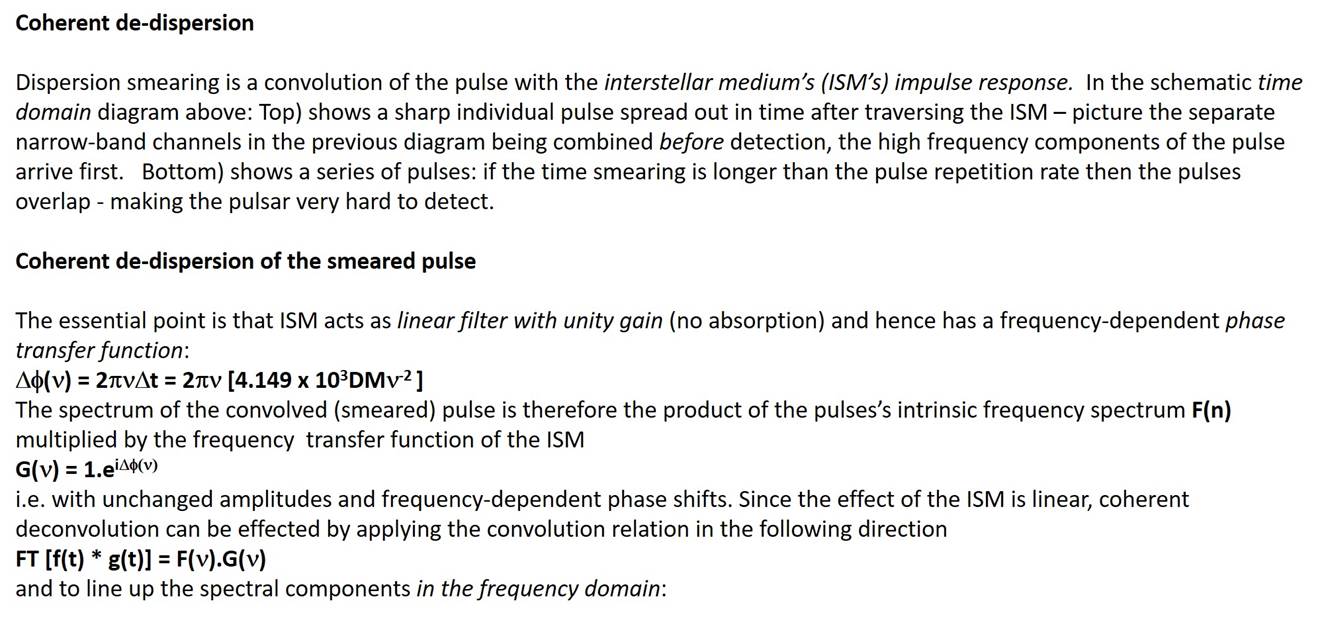
Pulse de-dispersion – the incoherent approach
The Time Variable Radio
Sky
Overview
Pulsars are just one type
of time variable radio source. Our
knowledge of the “Dynamic Radio Sky” was first described in some detail by
Cordes et al (2004), New Astronomy,
Reviews, 48, 1459
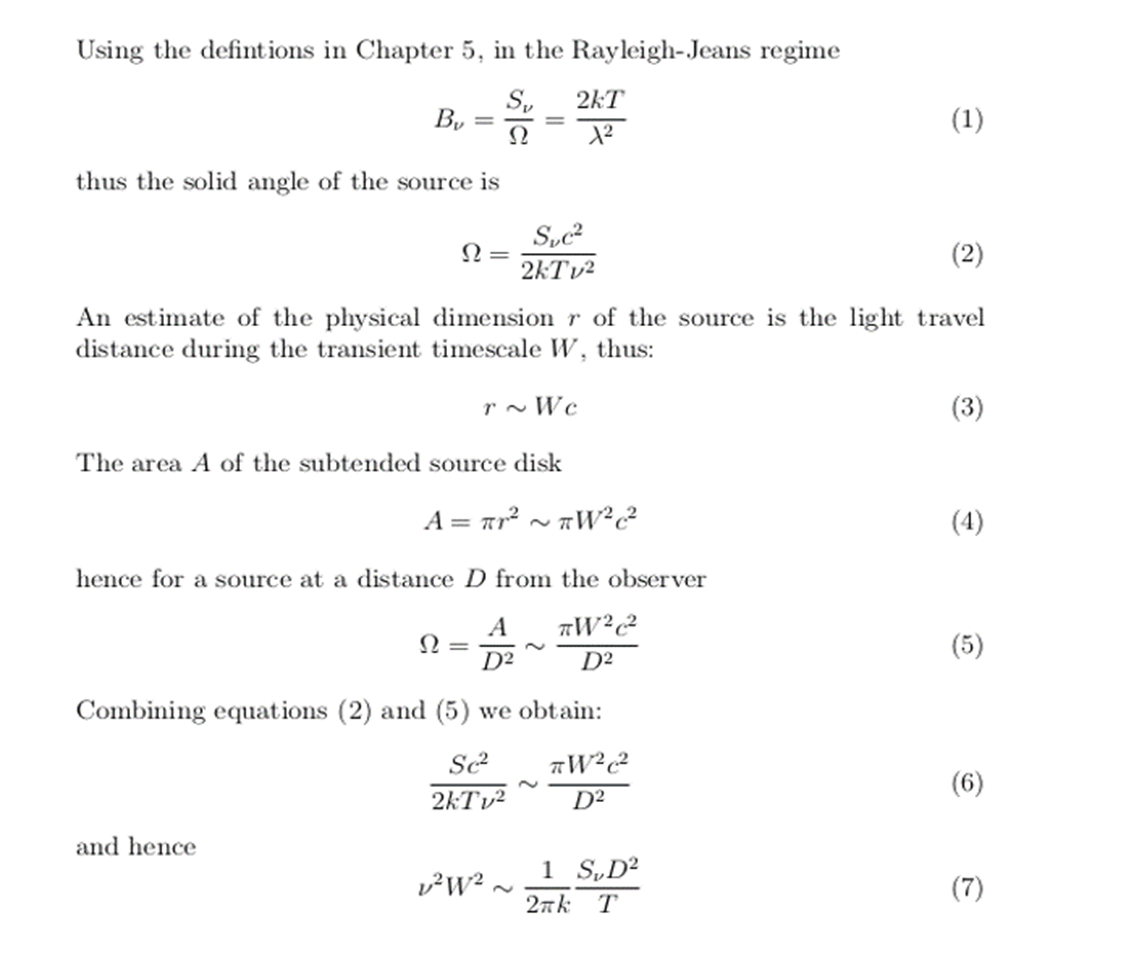
(see also https://arxiv.org/abs/astro-ph/0410045v1) who give the useful relation
![]()
between the timescale of a transient W, its flux density S, its distance D, its brightness temperature T
and the observing frequency n. This relation, which
helps to differentiate between the different types of variable sources (see the
diagram below). This relation can be
derived as follows:
At a given frequency the peak
transient flux density Speak multiplied by
D2 is related
to the peak luminosity Lpeak
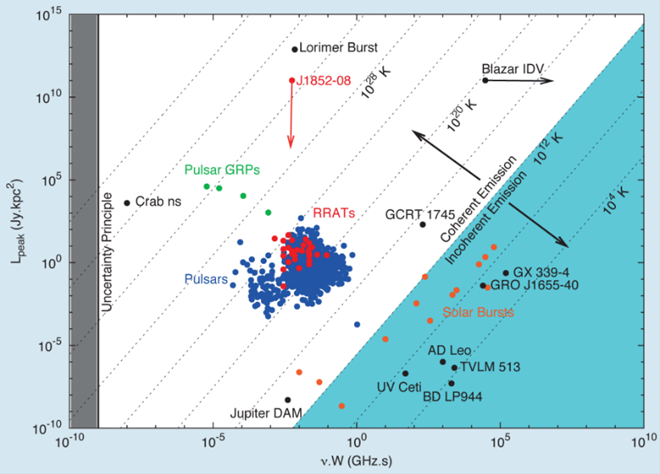
The figure above is the time–luminosity diagram of radio transients taken from an
accessible article by Breton and Halsall Astronomy & Geophysics, Volume 54, Issue 6, 1 December 2013, Pages 6.36–6.39
(see also https://doi.org/10.1093/astrogeo/att206). The diagram encapsulates
our observational knowledge of the transient sky (see also Cordes et al. 2004).
Objects in the region to the lower
right can be radiating by incoherent processes whose brightness temperature T
in the rest frame cannot exceed ~1012K (see section
2.8); objects to the upper left must be radiating by coherent processes (see also
Cordes et al 2004).
The study of the transient sky will be a significant task for
the SKA - see for
example the overview presentation by R. Fender et al (2015) https://pos.sissa.it/215/051/pdf but
note that this is a rapidly developing field (see below).
Fast
Radio Bursts
The first of a previously unsuspected
class of radio emitters – the Fast Radio Burst sources (FRBs) - was discovered in
2007 when Duncan Lorimer and a graduate student were analysing archived pulsar
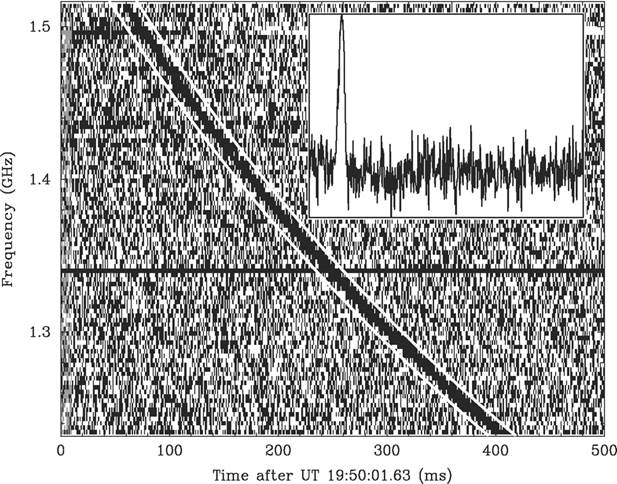
search data taken with the Parkes (in Australia) radio telescope in 2001. The story of the recognition of this unusually
bright and short individual pulse of radiation, the “Lorimer Burst”, is told by
Lorimer et al (2007). The arrival time vs. observing frequency
diagram of the burst shows the characteristic signature of FRBs: an individual
burst of a few milliseconds duration which shows the effect of dispersion in
the ISM (see descriptions above).
Most of the ~300 FRBs (April 2019) now
discovered (and the number is increasing rapidly particular from the CHIME
telescope) appear to be solitary events but a significant number are known to
repeat which makes them much easier to study. Nevertheless the
origin of FRBs, and whether there is more than one type of physical mechanism
at work, is currently unknown. Most, if not all, are likely to be associated
with extragalactic objects at cosmological distances since FRB dispersion
measures are typically 10x that expected from the Milky Way’s ISM. The extragalactic hypothesis received strong
support when the first of the repeaters FRB 121102 was identified as lying in a
dwarf galaxy at a redshift z=0.19 (Chatterjee et al. 2017; Tendulkar 2017). At the SKA
Science 2019 meeting (se the programme of
speakers at https://indico.skatelescope.org/event/467/
) it was reported that ASKAP has
located the positions of three FRBs to sub-arcsecond accuracy which places them
in galaxies in the redshift range 0.29 to 0.49 (paper by Ryan Shannon) and that
CHIME has found 250+ new FRBs with 12 of them being repeaters (paper by Paul
Scholz). The distribution of FRBs on the sky appears to be random which is an
independent pointer to a cosmological origin.
FRB research is continuing to grow in astrophysical
and cosmological importance as increasingly powerful searches and the
identifications of host galaxies are enabled by the new generations of sensitive,
wide-field, radio telescopes and arrays. As a result this
is an extremely fast-moving area of research; at the time of writing the most
up-to-date published review is that by Petroff, Hessels and Lorimer (2019) https://arxiv.org/abs/1904.07947.
An on-line catalogue of sources FRBCAT (https://arxiv.org/abs/1601.03547) is continuously updated by Petroff et al. The CHIME/FRB collaboration has (in 2021) published
a catalogue of 536 fast radio bursts and discussed their phenomenology https://arxiv.org/abs/2106.04352