Supplementary Material
to:
An Introduction to Radio Astronomy
4th edition Cambridge University Press 2019
Last updated 1/07/2019
Chapter 14: The Milky Way Galaxy
Continuum
emission
Multiwavelength surveys and the Chromoscope
visualisation tool
The “Chromoscope” web site http://www.chromoscope.net/
gives a beautiful visualisation of the galactic emission across the electromagnetic spectrum
Lists of multi-wavelength surveys can be found
at: https://skyview.gsfc.nasa.gov/current/cgi/survey.pl#Bonn%201420%20MHz%20Survey
Large
area maps of the diffuse continuum radio emission
At metre and centimetre wavelengths the diffuse emission is dominated by synchrotron radiation from high-energy electrons accelerated in the interstellar magnetic field. Mapping this emission over the whole sky requires the combination of observations from telescopes in both hemispheres, demanding meticulous calibration and removal of sidelobe effects.
There is an extensive list at https://lambda.gsfc.nasa.gov/product/foreground/fg_diffuse.cfm but it is incomplete at low radio frequencies and new surveys are
constantly being made. At
low radio frequencies (<100 MHz) note the “all sky” maps at
· DRAO 22 MHz (Roger et al 1999) https://arxiv.org/abs/astro-ph/9902213
· 45 MHz (Guzman et al 2011) https://www.aanda.org/articles/aa/pdf/2011/01/aa13628-09.pdf
· LWA1 35-80 MHz (Dowell et al 2017) see https://arxiv.org/abs/1705.05819
· OVRO-LWA 37-83 MHz (Eastwood et al 2017) https://arxiv.org/abs/1711.00466
and https://lambda.gsfc.nasa.gov/product/foreground/ovrolwa_radio_maps_info.cfm
At deci- and centimetric wavelengths note the maps at
·
408 MHz (see Supp. Mat Chapter
8) https://arxiv.org/abs/1411.3628
·
1420 MHz see https://www3.mpifr-bonn.mpg.de/survey.html).
and two other all-sky continuum centimetric
surveys which are in progress (2019):
-
GEM (e.g. https://www.aanda.org/articles/aa/full_html/2013/08/aa9306-07/aa9306-07.html
and references therein)
-
C- BASS (5 GHz intensity and polarization); see https://cbass.web.ox.ac.uk/gallery
for Northern sky maps and the current status of the project towards completion.
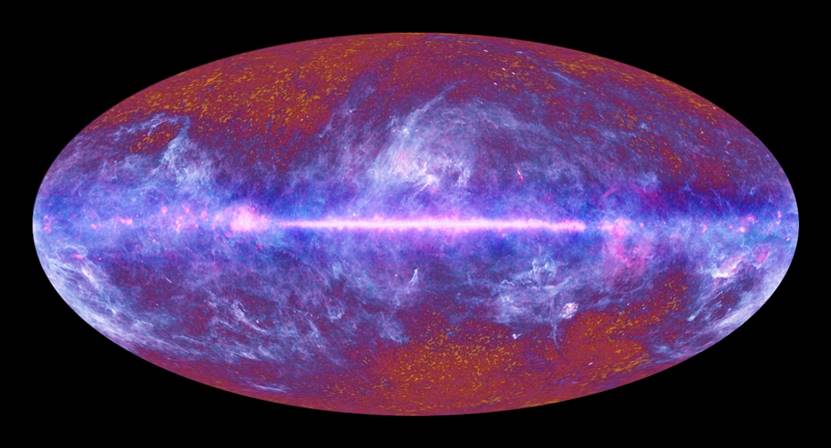
At millimetric wavelengths the best all-sky maps are provided by
the ESA Planck spacecraft. The image above is a colour
version of Fig 14.2 in the main text. http://www.ukspaceagency.bis.gov.uk/assets/image/jpg/PLANCK_FSM_03_Black.jpg
The emission from our galaxy (blue) is a “foreground” to the emission
from the Cosmic Microwave Background (a black body) rendered in purple (at top and bottom).
The galactic radiation is principally a mixture of optically thin synchrotron
emission from relativistic electrons and magnetic fields + optically thin “free-free”
emission from warm/hot interstellar ionised gas + quasi-black body
radiation from cold interstellar dust. The typical brightness temperatures at this
resolution (5 arcmin) are
< 100K .
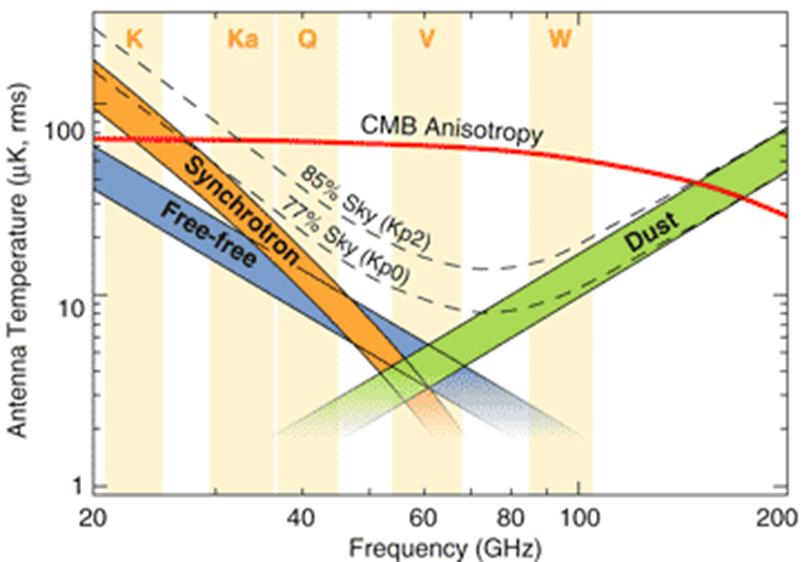
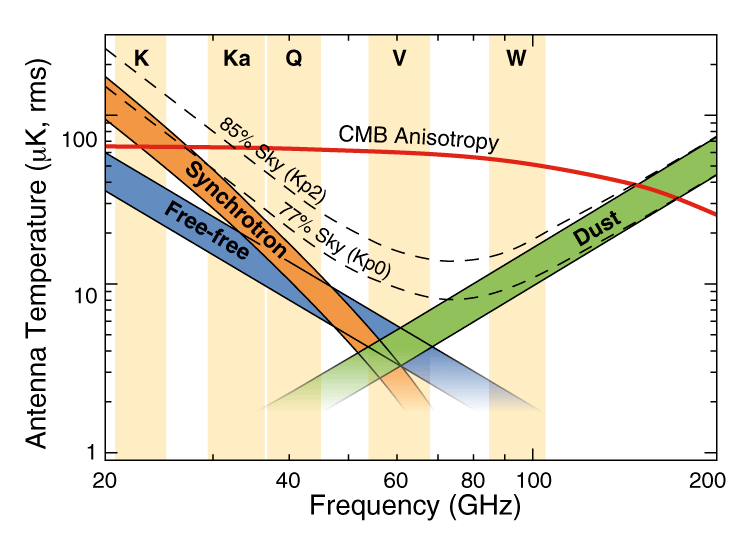
Spectra
of the components of the diffuse emission
Notes:
1) The log-log spectrum
plotted above is from http://map.gsfc.nasa.gov/media/070961/070961Ab.png and is in terms of antenna temperature thus
calibrated with respect to a black body. The Rayleigh- Jeans approximation for the
brightness of a black body is :
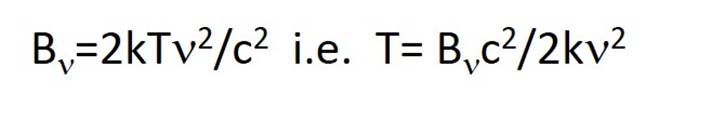
hence the power law spectral slope for
optically thin “free-free emission” (-0.1 in terms of brightness
or flux density) becomes
-2.1. The equivalent synchrotron spectral slope ( -0.7) becomes
-2.7.
2) Only part of the
spectrum is plotted. The
dust spectrum peaks off to the right of the graph (corresponding to quasi-black-body
radiation with T~60K) while the peaks of the free-free and synchrotron spectra are off to the left of the graph. The
free-free radiation at frequencies above a few GHz comes from optically-thin
regions and hence has a falling power law spectrum rather similar to the
non-thermal synchrotron radiation. The
contribution of spinning dust (see entry in Supp. Mat Chapter 2) to the all-sky emission is not shown. (See
also Fig 17.3 main text, reproduced in colour in Chapter 17
Supp. Mat.)
Higher resolution continuum imaging
At higher resolution many discrete features of the ISM become apparent
in continuum emission: ionized HII regions, planetary nebulae and supernova
remnants at various stages of their evolution.
There is also a background of extragalactic radio sources. Particular surprises
have come from images of the region around the galactic centre (GC), where
optical and near infra red radiation cannot
penetrate. VLA imagery (e.g. https://www.nrao.edu/pr/2000/vla20/background/galcenter/
and http://images.nrao.edu/326) showed
unexpected filamentary “threads” of emission which are believed to be due to
strong magnetic field structures
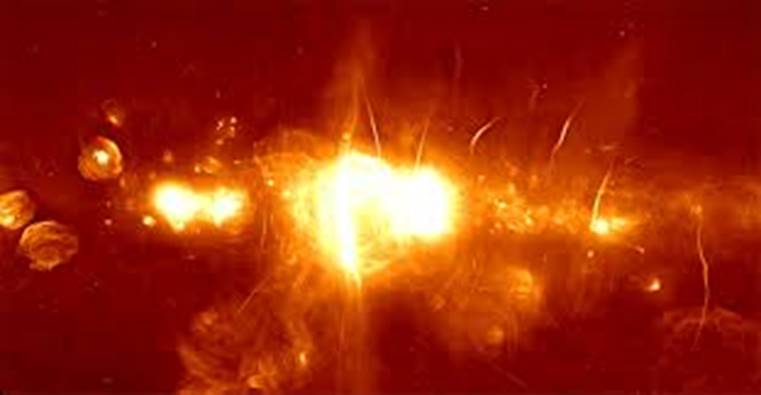
.
The new South African array MeerKAT is ideally placed to study the regions around the GC and the clearest view is the image released to coincide with the opening ceremony in July 2018. For a description see https://www.ska.ac.za/media-releases/meerkat-radio-telescope-inaugurated-in-south-africa-reveals-clearest-view-yet-of-center-of-the-milky-way/.
On a
wider scale the low-frequency MWA array in Australia has carried out the GLEAM survey
http://www.mwatelescope.org/gleam.
An
introduction to the survey with a range of images can also be found at https://sciblogs.co.nz/guestwork/2016/10/28/radio-astronomy/)
The GLEAMoscope web site (an extension of the CHROMOSCOPE to
metre wavelengths) is: http://gleamoscope.icrar.org/gleamoscope/trunk/src/
The Canadian Galactic Plane
survey (http://www.ras.ucalgary.ca/CGPS/; see also Taylor et
al 2003, Astronomical Journal, 125,
3145.) is an intensive effort to map both continuum
and HI emission in a specific region (galactic
longitudes l=74.2 to147.3 degrees; galactic latitudes -3.6 to +5.6 degrees) of
the plane at high resolution.
Other
higher resolution surveys of the galaxy are underway – and example is the THOR
survey with the VLA http://www2.mpia-hd.mpg.de/thor/Overview.html. A first publication with continuum images
http://www.mpia.de/homes/beuther/wang2018.pdf
The Galactic Magnetic Field
Rotation measures in the Milky
Way
As
discussed in Section 14.10 the polarisation structure of the Milky Way, viewed from
the Sun’s position within the plane, is complex due to the effects of Faraday
rotation and depolarisation which are particularly present at low frequencies
(<1 GHz). At higher frequencies rotation
measures of pulsars and extragalactic sources probe the field.
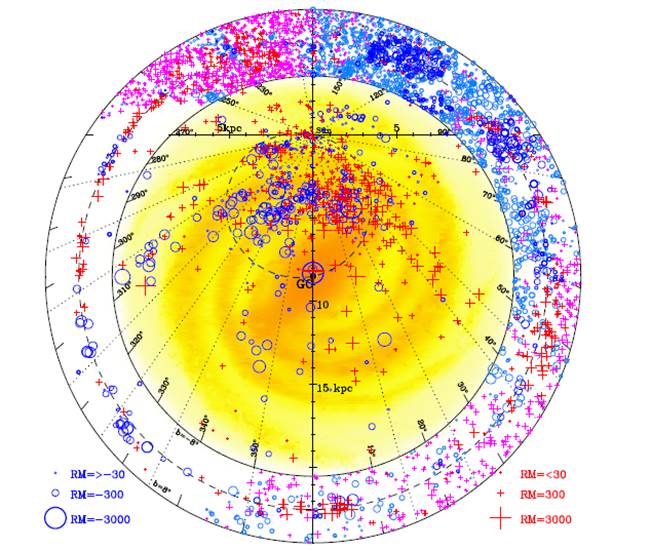
An
updated version of Fig 14.17 is shown below. It shows the Rotation Measures
(RMs) of pulsars and extragalactic radio sources (EGRs) galactic coordinates. The central
region shows RMs of pulsars at low galactic latitude (<8 degrees); the outer
annulus shows RMs for EGRs with latitude <8 degrees. For further details see
Han et al Ap.J. Supp.
234, 11 (2018)
Magnetic fields in an external spiral galaxy
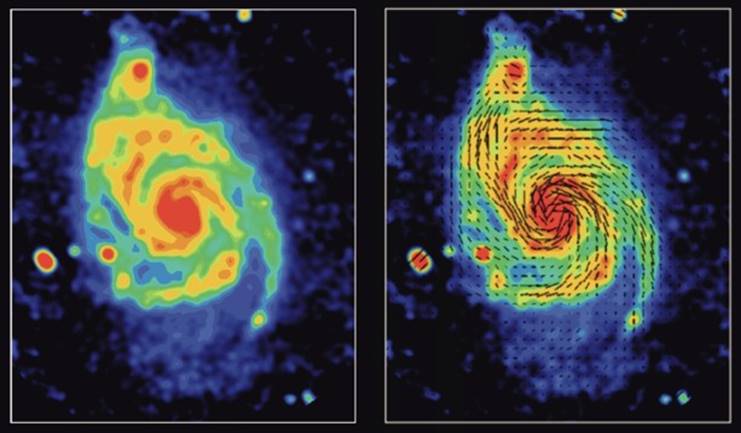
A complementary
image to Fig 14.19 of the nearby galaxy M51 is shown above. It was made from a
combination of the VLA and Effelsberg 100m telescope
(http://images.nrao.edu/336) and shows that in a spiral galaxy like the Milky Way
the magnetic field is strongly tied to
the inner edge of the spiral arms [Image courtesy
of NRAO/AUI; Investigator(s): Rainer
Beck (MPIfR Bonn, Germany), Cathy Horellou
(Onsala Space)]. For a summary overview of
magnetic fields in galaxies see https://ned.ipac.caltech.edu/level5/Sept13/Beck/Beck4.html
The Milky Way in HI
The principal image from
the all-sky 21cm HI line survey HI4PI (theHI4PI
collaboration A&A, 594, A116 (2016) see also https://arxiv.org/abs/1610.06175 and is shown in
Supp. Mat. Ch 3. The reader should
consult the original papers for full details.
As noted in Supp. Mat.
Chapter 3 an excellent source of instruction and information on galactic HI
observations, including downloadable spectra taken with large radio telescopes,
can be found at: https://www.astro.uni-bonn.de/hisurvey/euhou/HI_Spirals_HowTo.pdf
The
Galactic Plane in
CO
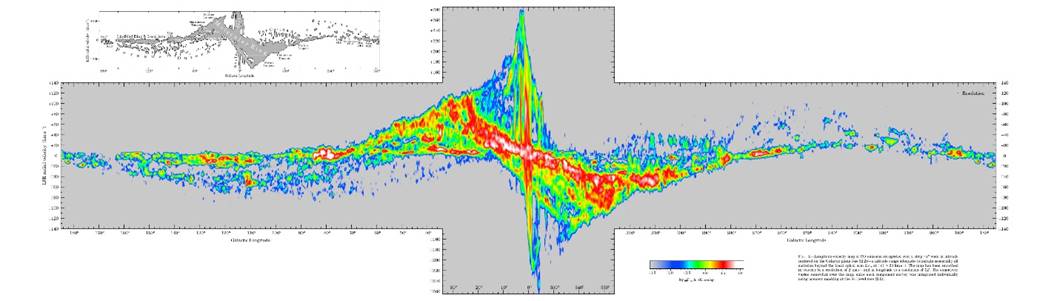
A complete survey of the Milky Way in Carbon
Monoxide (CO) has been carried out by T.M. Dame, D. Hartmann, & P. Thaddeus
2001, ApJ,
547, 792. Many images of the results, which complement the discussion in
Section 14.3 can be found at
https://www.cfa.harvard.edu/mmw/MilkyWayinMolClouds.html).
The figure above is a
later version of the Galaxy longitude-velocity diagram
(Fig 14.10 main text).
Future radio studies and the ISM
Heiles et
al (2019) https://arxiv.org/abs/1904.01237
provide a forward look into the potential of
the large area radio telescopes FAST and then SKA to provide new information
and insights into the ISM from continuum and spectroscopic observations in the
L-band.
Lonsdale et al (2019) https://arxiv.org/abs/1903.06584 discuss the potential of all sky polarimetric maps, particularly at long wavelengths, to provide a deeper understanding of the role of the ISM’s magnetic field.
HI in external galaxies
Early
WSRT measurements of rotation in M81
HI
observations are ideal for tracing the dynamics of galaxies. Despite the low
surface brightness of HI the large telescopes built in
the c20th have sufficient sensitivity and resolution to make
detailed studies of many nearby galaxies.
An early example is the mid-1970s WSRT work on the spiral galaxy M81
(A.H. Rots and W.W. Shane (1975), A&A,
45,25).
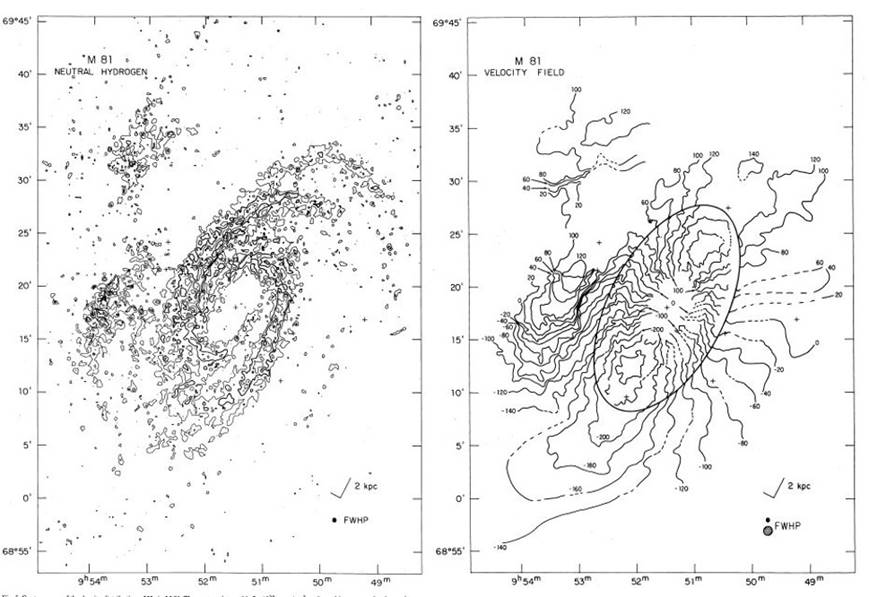
Left) A contour plot of the hydrogen
distribution in M81; right) the velocity field contours. In the top right quadrant the velocities are
+ve (gas receding) while in the bottom
left quadrant the velocities are -ve (gas
approaching). Such velocity fields
indicate overall rotation of the galaxy and were often dubbed “spider
diagrams”. (A.H. Rots and W.W. Shane (1975), A&A, 45,25).
For colour pictures of HI in and around the local galaxy M33
see http://www.jb.man.ac.uk/distance/radio/course/sourcesII/sourcesII4.html.
The
THINGS survey and its results
More
examples of how the Milky Way could look from the outside (see Section 14.2
main text) can be gained from the results of the THINGS survey of neutral
hydrogen in nearby external spiral galaxies (Walter et al (2008) AJ,
136, 2563) - see also https://arxiv.org/abs/0810.2125. The images have been collected together in a poster
format - see http://www.mpia.de/THINGS/THINGS_Poster.html and http://www.mpia.de/THINGS/THINGS_Poster_files/THINGS_Poster.pdf
The
THINGS images show that while some galaxies exhibit clear spiral arm structures
(as in M81 above) in others the arms are less prominent. For comparison the centre of the poster shows
the original HI map of the Milky Way (similar to Fig. 14.8 in the main text).
The THINGS data have allowed
De Block et al (2008) AJ, 136, 2648 (see https://arxiv.org/abs/0810.2100) derive
rotation curves of 19 nearby galaxies. These are the highest quality H I
rotation curves available to date for a large sample spanning a wide range of H
I masses and luminosities. The derived mass
models are consistent with infra-red luminosities (from Spitzer spacecraft
data) and stellar population syntheses; they show that the spiral disks
themselves do not contain a large amount of dark matter. The dark matter must
be in surrounding haloes since the rotation curves stay flat well beyond the
stellar distribution cut-offs. However,
the empirically-derived density of dark matter is about half that predicted by
CDM simulations.
The
Local Volume HI Survey (LVHIS)
In the southern hemisphere the LVHIS survey (Koribalski et al 2019) https://arxiv.org/abs/1904.09648 have mapped nearby (within 10 Mpc) 82 gas-rich galaxies in both continuum and HI-line. Koribalski et al present the data; future papers will provide interpretation of this extensive data set likely to involve many of the same issues which motivated the THINGS survey.
The WALLABY and APERTIF Surveys
Phased array feeds (see Section 8.7
and Supp Mat Chapter 8)
greatly enhance a dish’s field of view. As a result
previously impossible sky surveys can be carried out. In the southern
hemisphere WALLABY
hydrogen line survey on the SKA pathfinder ASKAP array (see https://wallaby-survey.org/ ) anticipates detecting up to 600, 000 galaxies out to
z=0.4. In the northern hemisphere the
complementary APERTIF HI survey on the WSRT (see www.apertif.nl ) is also expecting at least 105 galaxy detections.
The
SKA and HI
Deep observations of HI was the
principal driver for the “Hydrogen Array” proposed in 1991 (see hydrogen_array.pdf)
and remains a prime goal of the SKA (see SKA Science Priority Outcomes http://www.caastro.org/files/29/3087793188/ska1scienceprioritiesoutcome.pdf.) The SKA will
be able to image HI in 102-103 of times more galaxies,
out to greater distances, than will these precursor surveys. The SKA will also
image the ultra-faint hydrogen distribution around and between nearby galaxies;
it may be the latter studies which produce the greatest surprises!
Tidal
Effects in the M81 group of galaxies
Deep HI imaging around nearby galaxies
reveals more than just rotation curves extending beyond the stars. The classic VLA
study by M.S. Yun, P.T. Ho and K.Y. Lo 1994 (Nature, 372, 530) of atomic hydrogen in the M81 group of galaxies (see below) clearly shows
evidence for tidal interaction between the galaxies with filamentary streams of
gas connecting the galaxies.
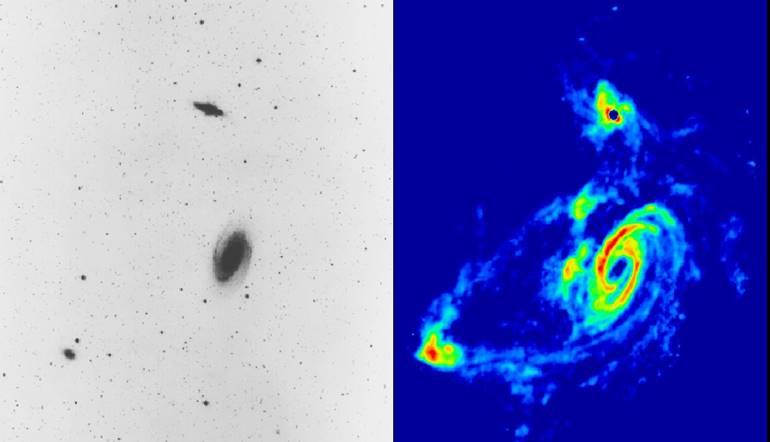
The left image is in the visible band from
the Palomar Sky Survey and shows the dominant galaxy M81 near the centre with
M82 above it and XXX to the bottom left. The right HI image is constructed from
VLA data
See Yun Min’s Page at http://www.astro.umass.edu/~myun/m81group.html for more details This web page also has a link to a
short movie which models the tidal interaction.
A further detailed study of
this complex of galaxies has recently been presented by W.J.G. Blok et al https://arxiv.org/pdf/1808.02840.pdf