|
|
The Drake Equation
|
|
|
The Drake Equation
|
| The probability of success is difficult to estimate, but if we never search, the chance of success is zero. |
|
Philip Morrison & Guiseppe Cocconi Nature, 1959 |
|
|
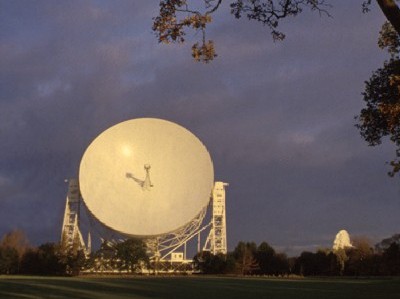
Figure 1. The University of Manchester's 76-metre Lovell Radio Telescope at Jodrell Bank, UK. |
In this module you will be given an introduction to the science of SETI from its origins in 1959 to the present day. At its end you will be aware of the way in which the search for signals from another civilisation has increased in both sensitivity and frequency coverage, thus increasing the chances of contact, and have an initial understanding of the Drake Equation which attempts to predict the number of civilisations in our galaxy with whom we might come into contact.
It was the building of the 250ft MK1 radio telescope at Jodrell Bank in 1957, Figure 1, that brought the realisation that two such telescopes equipped with powerful transmitters would be capable of communicating across interstellar distances. In 1959 Cocconi and Morrison published the seminal paper in the subject pointing out that, given this possibility, it might be worth attempting to listen out for extraterrestrial signals. They also addressed the two most important questions that need to asked before a search could begin; that of where to look and then at what frequency to search. The following year Frank Drake and his colleagues carried out the very first SETI experiment, called project Ozma, and the search has continued with ever increasing sophistication ever since.
Given limited resources it seems sensible to carry out a "targeted" search looking at those locations where it seems most likely that another civilisation would exist. The authors argument is still regarded as valid today and assumes that the majority of other lifeforms would be based on the same chemistry as ourselves. Life here is based on the chemistry of Carbon, the most diverse of any element, and uses the elements that exist in high abundance in the Universe such as Hydrogen, Oxygen, Nitrogen and Carbon. The existence of liquid water is almost certainly a necessity. If this is generally true of life elsewhere then we should seek planetary systems near a star that lived long enough for intelligent life to evolve, and hot enough so that there was a reasonable volume - the so called ecosphere - in which a planet could lie where water could exist as a liquid.
Very hot stars, though having very large ecospheres, burn up their fuel quickly and thus do not exist for a sufficiently long time, conversely cool stars though having lives of many billions of years have very small ecospheres very close to the star. A planet is then likely to be "locked" to its star, with one side of the planet permanently facing the star and so hot, but with the other facing away and thus very cold, so freezing out the atmosphere. We should thus seek out stars similar to our Sun ( not too surprising as we are here discussing this question ) which have lives of order 10 Billion years and reasonably large ecospheres. In their proposed target list Cocconi and Morrison included two G type stars around 11 light years away called Tau Ceti and Epsilon Eridani.
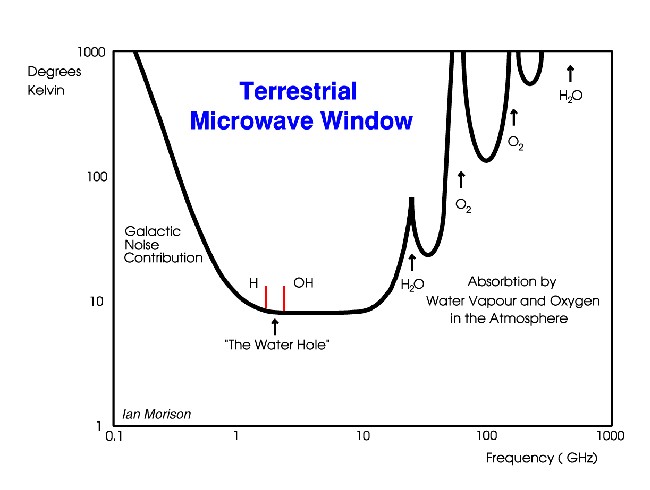
It is fairly obvious that one should use a frequency where there is as little as possible background noise that might mask the signal. At low frequencies electrons spiralling around the magnetic field lines of the Galaxy produce synchrotron radiation which would mask a weak signal whilst at high frequencies water vapour and Oxygen in our atmosphere have the same effect, see Figure 2. In between, there is a band, from 1,000 to 10,000 MHz, where the extraneous noise is a minimum. Sitting at 1420 Mhz, right in this band, is the frequency at which Hydrogen emits as the spins of the proton and electron change from being parallel to anti-parallel. This frequency is universal and would be known to all civilisations capable of communication across space, so Cocconi and Morrison suggested that the frequency band close to 1420 Mhz should be searched.
|
|
Figure 2. The terrestrial microwave window showing the "water hole". |
The width of the band would be related to the possible doppler shifts that would arise from the motion of the planet from which the signals arise about its parent star. They suggested a band of +/- 300 KHz should be searched to allow for relative motion between the planet and earth of 100 km/s. Since then emission frequencies around 1600 Mhz due to the Hydroxyl (OH) have been found. As H and OH together make up Water, the part of the spectrum between H and OH has been termed the Water Hole. This is a possible region of the spectrum where radio communications from another civilisation might be found. Another possibility might be the frequency of pi times the Hydrogen Line frequency.
|
|
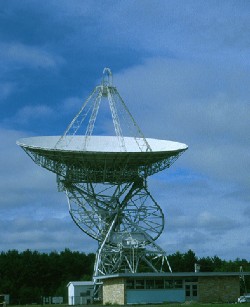
Figure 3. The 84ft Tatel Telescope at Green Bank. |
In 1960 Frank Drake and his colleagues used the new Tatel 84ft radio telescope at Green Bank in West Virginia, Figure 3, to carry out the first SETI experiment. The project was called OZMA after the land of OZ that lay over the rainbow in Frank Baum's book. The telescope was equipped with a state-of-the-art receiver operating around the Hydrogen Line frequency. Drake assumed that the transmission would be at this frequency but, to account for the effect of the Doppler shift due to the motion of the planets around our respective Suns, a band of frequencies either side of the Hydrogen Line was searched.
) Assuming that the maximum expected relative speed between the planet from which the signals might be originating and our Earth to be +/- 300 km/s, over what range of frequencies should we search to pick up a signal transmitted at 1420 MHz?
Assuming that the maximum expected relative speed between the planet from which the signals might be originating and our Earth to be +/- 300 km/s, over what range of frequencies should we search to pick up a signal transmitted at 1420 MHz?
|
The search observed Tau Ceti and Epsilon Eridani, stars from Cocconi and Morrison's list which were chosen as they are two of the nearest Sun-like stars and are away from the plane of the Galaxy, so that the background Hydrogen Line emission from the Galaxy itself would be low. (The very fact that the Hydrogen in the Galaxy emits at this frequency so increasing the background noise level against which a signal must be detected suggests that the Hydrogen Line frequency itself may not be the best frequency for SETI observations.)
The observations continued for two months. One signal was received shortly after the start when Epsilon Eridani was being observed and they realised that they had no means of proving whether a signal that lasted for a short time really came from the observed star or from something nearby. (For a continuous signal one can move the telescope off source when, if it had really come from the distant star system, it will disappear.) They thus added a separate small receiver which would only detect local signals. Later, when they detected the signal again, they were able to show that it was from a very high flying aircraft, the then top secret U2 spyplane! This does highlight the problem of proving that signals really do have an extraterrestrial origin.
In the summer of 1961, Frank Drake hosted a conference at Green Bank to discuss the probability of detecting a signal from another civilisation in our galaxy. The agenda for the conference was in the form of an equation, now called the Drake Equation. This attempts to evaluate the number, N, of civilisations with whom we might communicate as a function of a number of factors.
N = R* fp ne fl fi fc L
The detail of the equation will be dealt with in the next module and need not concern us here, but the result effectively reduces to two factors:
N = Rcc x L
Rcc is the rate at which civilisations desiring to communicate with others come into being, and L is the time for which they remain in a communicative phase. For example, let us suppose that such a civilisation comes into being every ~ 10,000 years. If such civilisations attempt to make contact with others for 1,000,000 years on average then we would expect there to be around 100 in our galaxy from whom we might possibly detect signals. On the other hand if they were only to attempt to make contact for 1000 years then there would be only a one in ten chance that there would be another civilisation attempting to communicate at the present time. It might be noted that our civilisation here on Earth would not be included in a similar calculation done elsewhere in the galaxy as we are not yet making any serious attempts to communicate with others.
The problem is that while some of the factors involved in the evaluation of Rcc are reasonably well known, we can only make educated guesses for others. Neither do we have any real idea of the typical value for L so our final estimate for N is not expected to be accurate. In fact it has been said that the Drake Equation is a way of encapsulating a lot of ignorance in a small space! Evaluations of N in the early days of SETI were probably on the optimistic side with values of up to 1,000,000 considered possible. Some now say that intelligent civilisations will arise only rarely and thus that we might be the only one existing in our Galaxy at the present time. The true answer will no doubt lie somewhere in between and the SETI projects could perhaps be regarded as an experimental way of finding the answer of how often advanced civilisations arise.
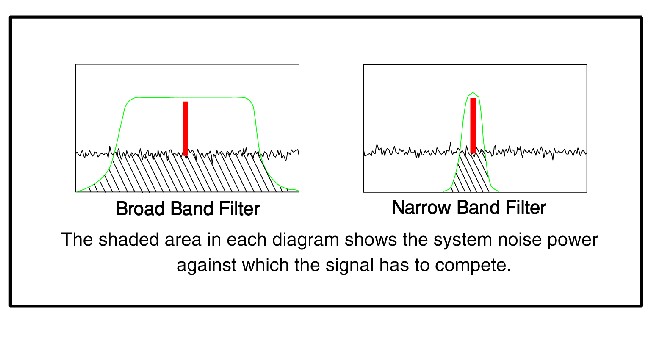
At least initially, we should expect that a civilisation attempting to make contact to transmit a signal that could be received over the maximum possible distance given the transmitter power and telescope used to transmit it. So we can ask the question as to what signal type could we receive with the minimum possible signal strength. Assume that we have a receiver mounted at the focus of a radio telescope. It will itself generate some noise power, usually expressed as the power of a black body at some temperature (typically 10 - 15 K). Radiation scattered into the system from the ground, synchrotron radiation from electrons in the Galaxy, absorption by Carbon Dioxide and Oxygen in the atmosphere at higher frequencies and even the background radiation left over from the Big Bang (equivalent to a black body at 2.76 K) all add to this noise to give what is termed the System Temperature of the telescope which might reach ~35 K. Over a small part of the spectrum this noise power is essentially constant. Any receiver system has a filter which defines the bandwidth B of the received signal, see Figure 4. The total noise power that any received signal will have to compete with is proportional to the bandwidth, so a signal that is limited to a very narrow band, and could hence be received within a narrow bandpass receiver will have the greatest chance of detection. (Drake used a 100 Hz Bandwidth for project Ozma.)
|
|
Figure 4. Bandwidth issues in signal detection. |
We thus expect that any beacon signal that we might receive will be very narrow band, but this does put limitations on the amount of information that can be received in a given time. The bandwidth occupied by a signal is ~ (Data Rate in bits per second) so a data rate of 1 bit per second would require a bandwidth of 1 Hz, 100 bits per second 100 Hz and so on. Thus for a signal to be received at the limit of detectability a long time would be required to receive significant amounts of information. Using the adage that a picture is worth 1000 words, it might thus be expected that a signal might be in the form of a very simple picture. Any signal must be capable of being easily decoded but it is valid for the sender to assume that the receiving civilisation will have mathematicians and scientists who can call on their own knowledge in interpreting the message.
|
|
Figure 5. Jocelyn Burnell with the 4.5 acre array that was used in the discovery of pulsars. |
In 1967 a young PhD student called Jocelyn Bell, Figure 5, helped build a large radio telescope array to study the effects of the solar wind on very distant radio sources called Quasars. This outflow of gas from the Sun is lumpy and makes the signal from the Quasar "scintillate" - an analogous effect to the twinkling of stars seen through our atmosphere. The receiver system was thus designed to be sensitive to rapid changes in intensity. It was expected that when the Quasar was observed in the daytime, close to the direction of the Sun, these effects would be most marked, but when observed at night time in a direction away from the Sun the effect would be far less. Much to Jocelyn's surprise she noticed a radio source that seemed to be scintillating when observed at night. It also seemed to be somewhat sporadic in its appearance - not at all what was expected. With her supervisor Tony Hewish, she set up a fast chart recorder to investigate the signal when it next appeared, Figure 6. Much to their amazement they found, not a scintillating quasar, but a series of regularly spaced pulses 1.337 seconds apart. Such a regular cosmic signal was then unheard of and they seriously considered that these might be a message from an extraterrestrial civilisation and called the source of the intriguing signal LGM 1 where LGM stood for "Little Green Men"!
|
|
Figure 6. The pulsar discovery charts. |
They soon showed however that the source was on the sky, not the Earth, as it passed through the south facing beam of the telescope around 4 minutes earlier each day - just as distant quasars do. This is just the result of the sidereal day ( the time for the Earth to rotate once relative to the stars ) being about 4 minutes less than the solar day. After a few months they concluded that the source was not on a planet orbiting a star as there was no change in the period which would have been produced by the doppler effect as the planet moved in its orbit. This led them to believe that the source was a natural phenomena, soon supported by the discovery of a second similar source. Before long it was shown that the signals came from rotating neutron stars - the remnants of supernova explosions in which the core of the star collapses under gravity until it is about 20 km across. As a result of the conservation of angular momentum the core spins up and may initially be rotating some 50 times a second. The magnetic field is compressed too and this rotating field produces beams of light and radio waves which sweep across the sky like that of a lighthouse. As the beam crosses the position of the earth we receive a pulse of energy. The objects are thus also called "Pulsars" and now around 1200 are known.
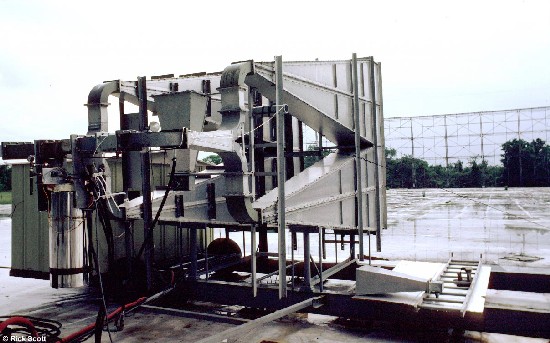
The first long term SETI search was begun in December 1973 using the Big Ear antenna operated by Ohio State University under the direction of Professor John Kraus, Figure 7. It was carrying out an all sky survey rather than a targeted search, observing the sky as it passed through the main beam of the telescope aligned directly to the south. It operated continuously for many years with a receiver providing 50 channels, each of 10 Khz bandwidth around the Hydrogen Line Frequency.
|
|
Figure 7. The feed system at the focus of the Big Ear telescope. |
|
|
Figure 8. The "Wow" signal showing the sequence in channel 2 of the characters 6EQUJ5. |
The "Wow!" Signal
On August 17th 1977 channel 2 of the receiver detected a signal reached a maximum strength of 30 times the background noise level. As Jerry Ehman, who was analysing the data, observed the computer printout and saw the rising and falling sequence of data he explained "Wow!" He then circled the pattern on the printout and wrote "Wow!" in the margin. It has been called the "Wow!" signal ever since, Figure 8. As the signal had only appeared in channel 2, centred on 1420.356 Mhz, it was narrow band, as would be expected for an "ET" signal. The characters on the printout in successive 12 second time intervals were 6EQUJ5. The Ohio team had decided to code the detected signal strengths into a single character covering a range of 36 in power. The lowest levels were simply the numerals 1 to 9, but then the letters A to Z were used for increasing signal strengths. So the successive intensities were:
6 - 14 - 26 - 30 - 19 - 5
The value U was the largest value they had ever seen. It was not surprising that Jerry Ehman had written "Wow!" on the printout! Equally interesting was the fact that the rise and fall of the signal strength as the source passed through the beam of the antenna exactly matched the antenna's beam shape - just what you would expect if the signal had come from a very great distance. The band around 1420 Mhz is protected so no signals from Earth should be found there and the direction was away from all known satellites. The direction in the sky from which this signal was received has been observed many, many times since, but the signal has never recurred. To this day no one is sure what might have caused the signal. If it really had been a signal from ET then surely he would have called again. As Ehman himself said "We should have seen it again when we looked for it 50 times. Something suggests that it was an Earth-bound signal that simply got reflected of a bit of space debris."
In 1994 a new 4 million channel receiver was installed, each channel having a 1 Hz bandwidth, and a facility added to enable the telescope to track a source for over an hour should a suspicious signal be detected. Sadly Ohio State University recently sold the land on which the telescope stood for use as a golf course and the telescope was dismantled so ending the longest running SETI project yet undertaken.
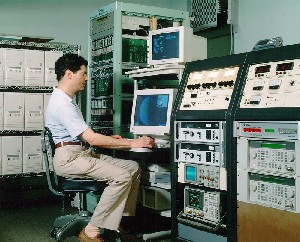
Funded in part by the American Planetary Society Professor Paul Horowitz has been carrying out SETI using the relatively small Harvard/Smithsonian, 26m, antenna but allied to very sophisticated signal processing systems, Figure 9. Project META (Megachannel Extra Terrestrial Assay) used a receiver with 8.4 Million channels, thus capable of observing a relativity wide bandwidth (400 KHz) with very narrow bandwidth (0.05Hz). Over a 5 year observing period having searched 60 trillion channels they discovered 37 candidate signals that had the right characteristics, but further observations both by them and the far more sensitive system employed in Project Phoenix (see below) have failed to detect them a second time.
|
|
|
Figure 9. At left, the 26m telescope used in projects META and BETA. At right, Paul Horowitz sat in the Project Beta control room. | |
Now, in Project BETA, the work is continuing with a new 240 Million channel receiver capable of covering the whole "waterhole" band from 1.4 to 1.7 GHz. Initially the telescope is used in "survey mode" observing due south and letting the earth's rotation bring each location in the sky at a given declination through the beam of the telescope. But, to eliminate terrestrial interference, three receivers are being used. Two are analysing the signals from two telescope beams slightly offset on the sky, such that a source will first pass through the East beam followed by the West. The third has a low-gain terrestrial discone which will only pick up local interference. A candidate ET signal must first be seen in the East beam, then the West beam but not, of course, appearing in the low-gain terrestrial antenna. A signal which passes this test is then re-observed by shifting both beams a little to the west (by moving the telescope slightly) hoping that the second set of observations confirms the first. If that should happen, the antenna would come out of its survey mode and track the position in the sky from which the signal was coming, repeatedly moving on and off the candidate source. A real ET signal would of course disappear when the telescope was off source.
NASA has over the years provided funding for SETI work and was, in the 1980's preparing for a major SETI search which would have included both a targeted search ( the nearest Sun-like stars) and an all-sky survey. The project was being run for NASA by the SETI Institute who had developed a sophisticated search technique using two telescopes simultaneously to allow immediate elimination of local terrestrial interference and, should an ET signal be detected, confirmation of its extraterrestrial origin. The targeted search got underway on the 500th Anniversary of the landing by Columbus in America using the 305m Arecibo telescope in Puerto Rico as the prime telescope. Sadly late in 1993 the US Congress cut funding for NASA's SETI research and the project was closed down. However the SETI Institute was able to obtain private funding to continue with the targeted search element in what became known as Project Phoenix, discussed in detail in a later unit. Observations resumed in 1996 making observations of stars in the Southern Sky from Australia.
SETI researchers at the University of California, Berkeley, have neatly circumvented the problems (and cost) of acquiring telescope time by using a "piggyback" system in which an extra receiver is mounted onto a telescope and simply observes wherever the radio astronomers using the telescope happen to be looking. Since 1978 they have been carrying out Project SERENDIP with ever increasing sophistication.
|
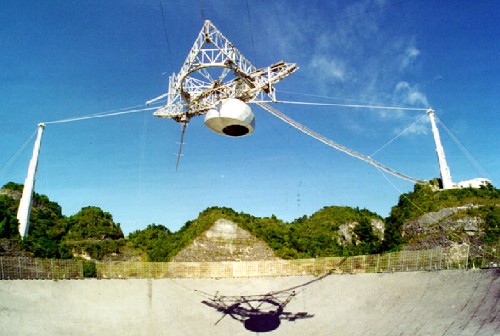
Figure 10. The focus of the 305m Arecibo Telescope in Puerto Rico. |
|
Their receiver is currently mounted on the Arecibo Telescope in Puerto Rico, the world's largest and most sensitive - Figure 10, and observes for around 60% of the time. It is observing a 100 MHz wide band of frequencies centered on the Hydrogen Line Frequency and splits it into 168 million radio channels of 0.6 hz bandwidth. Over time the SERENDIP system will observe the majority of the sky accessible to Arecibo, from declination 0o to declination +38o, about 30% of the entire sky. The data is recorded for later analysis. Part of this data is now being analysed in home computers the world over in what is called SETI@home. It has around 400,000 active participants analysing a 2.5 Mhz MHz band of the total SERENDIP data which is split into work units containing 107 seconds of data from a 10 Khz sub-band. Each unit takes around 40 hours to analyse on a typical home PC. As with Project Phoenix, SETI@home will be studied in detail in a later unit.
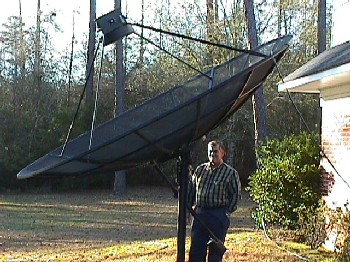
There is now an active amateur SETI project operated under the auspices of the SETI League. The idea is to use a very large number of small (3-4 metre) dishes to simultaneously observe the whole sky in the hope of detecting short duration signals, Figure 11. Because the dishes are small only powerful signals could be detected but, by using sophisticated processing on the received data using a PC of reasonable power, these systems would be capable of detecting signals such as the "Wow!" signal.
|

|
|
Figure 11. At left, a Project Argus 3.5m antenna. At right, a PC-based data analysis system. | |
Very large telescopes such as Arecibo can only detect signals from a very small part of the sky at one time and thus, in Project Phoenix, only observe a star system once during the course of the project. We have to assume that any civilisation there would be sending a continuous beacon signal towards us for us to have any real chance of detecting them. Project Argus has the ability to monitor the sky continuously so could, given a sufficiently strong signal, detect a civilisation that is sequentially beaming signals towards promising star systems like our own.
|
The 64 metre Parkes Telescope in Australia is equipped with a 13 beam receiver that operates across the "water-hole" region of the radio spectrum. Data from two of the beams are being stored and analysed to search for signals that are present in one beam but not in the other. A signal from ET would be observed as a narrow but sloped line on the waterfall plots like that shown in Figure 12. These plots show frequency across the graph and time down the graph. Weak signals can then be easily seen amongst the noise. All those on the graph are vertical indicating an unchanging frequency. Signals from beyond the Earth would show a changing frequency due to the Doppler effect caused by the rotation of the Earth.
|
|
Figure 12. A "waterfall" plot from Southern SERENDIP. |
In this module we aim to have provided an introduction to SETI and a brief history of various SETI projects up to the present day. In the next module we will expand on the Drake Equation.
|
|
The Drake Equation
|