2. Pulsars as Radio Sources
2.1 The pulsar magnetosphere
|
|
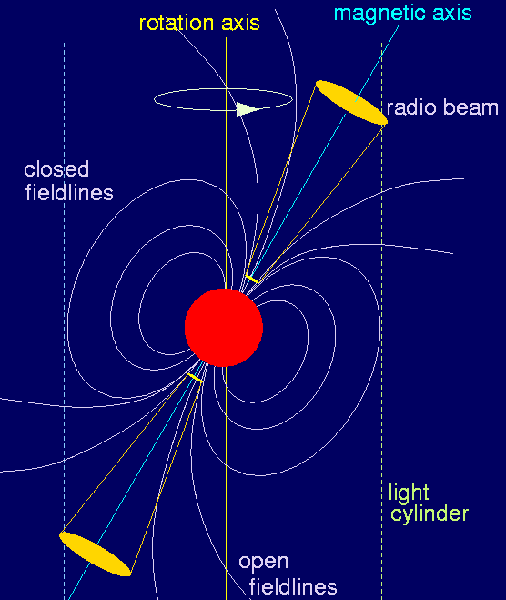
Figure 1. Pulsar model. |
The region around a pulsar, Figure 1, is filled by charged particles (a so-called "plasma") extracted from the pulsar surface. The pulsar's strong magnetic field forces the plasma to co-rotate with the neutron star as a rigid body, i.e. the rotation velocity of the plasma increases with distance from the pulsar. The distance where the rotation velocity reaches the speed of light defines the so-called "light cylinder".
As the co-rotation velocity cannot exceed the speed of light, co-rotation must stop at the light cylinder. As a result, the magnetic field lines can be separated in two classes, those field lines which are closed inside the light cylinder ("closed field lines") and those which would close outside but cannot since plasma would exceed the speed of light. These "open field lines" are centred on the magnetic axis, which is usually inclined to the rotation axis, similar to the situation on Earth. We call this ensemble of magnetic field and surrounding plasma the "pulsar magnetosphere".
2.2 The emission process
Plasma on the closed field lines is trapped and destined to
co-rotate with the pulsar forever. On the open field lines, however,
the plasma can escape the magnetosphere. As a result, the region
above the magnetic poles is depleted and new plasma is extracted from
the surface by an electric field which is twelves orders of magnitude
stronger than the gravitational field. The same field accelerates the
plasma to speeds close to the speed of light. Eventually new plasma is
created in a snow ball effect, and the whole plasma streams
along the open field lines. It is this plasma which creates the radio
emission in some distance above the pulsar surface. Whenever the
pulsar beam is directed towards Earth, we can register a
pulse.
 This animation demonstrates how a
pulsar acts like a cosmic light house.
|
The exact process creating the radio emission is not completely understood. The emission region is only a few hundred kilometres across but the fact that we can nevertheless detect pulsars over a large distance shows that the emission must be very intense. Computing the brightness temperature, i.e. the temperature of a thermally radiating body which shines with equal intensity, exceeds 1030 K. Comparing this to a maximum of 1012 K possible for a thermal black body, we conclude that the emission is "coherent", caused by a laser-type mechanism acting in the radio (also called microwave) region, i.e. a so-called MASER.
2.3 Single & average pulses
A single emitted pulse reflects the complicated processes happening in the pulsar magnetosphere, i.e. the creation and acceleration of plasma and the subsequently occurring radio emission. As a result, the individual pulses usually differ both in shape and intensity.
 This animation shows real pulses emitted by one of the
strongest pulsars in the sky, PSR B0329+54 with a period of 714
milliseconds.
|
In contrast, if one computes the average pulse shape from typically a few hundred pulses, the resulting so called "pulse profile" is always the same for a given pulsar observed at a given radio frequency. It is the pulsar's fingerprint and is stable with time.
2.4 A beam model
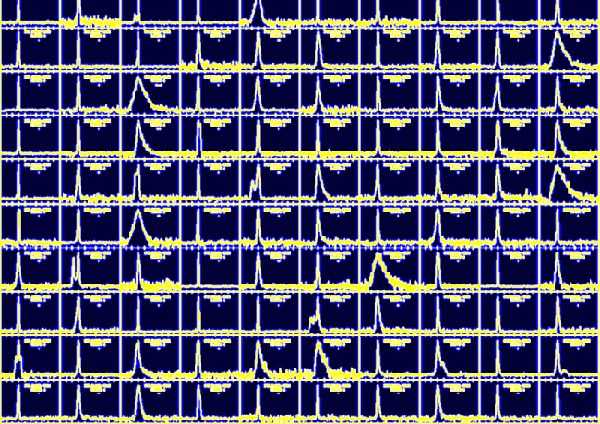
The composition of 100 different pulse profiles in Figure 2 shows some of the great variety observed. These profiles are those of pulsars which have all been discovered by Jodrell Bank astronomers and co-workers in a recent survey of the Galactic plane.
|
|
Figure 2. A montage of pulse profiles from 100 different pulsars. Click on the image to load a larger-scale version. |
|
|
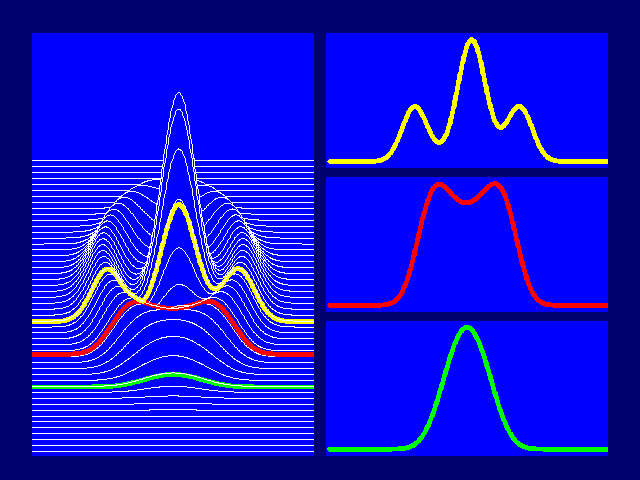
Figure 3. The core of the emission cone. |
Despite the fact that pulse profiles differ in detail, some systematics are observable. The most successful model describes, consistent with expectations based on theoretical grounds, the pulsar beam as having an overall shape of a hollow cone. Depending on how our line-of-sight towards the pulsar cuts this cone, different types of profiles are observed. Often there seems to be an additional emission component present in the centre or "core" of the cone, Figure 3, which is seen when our line-of-sight is favourable.
It seems that sometimes not the whole emission cone is equally well illuminated, adding to the complexity of the pulse profiles.
2.5 Polarisation properties
The radio emission of pulsars has another important property. We will try to describe this in the following. While it is not necessary to understand all details for the rest of the course, this emission property is very useful when using pulsars as tools.
Pulsar emission is highly polarised, very often up to 100%. In order to understand the significance of this, let us remember what polarisation means: We call an electromagnetic wave (e.g. radio or optical emission) polarised, if we observe that the electric field component of the wave prefers to swing in a particular direction. If it swings in a plane, the emission is linearly polarised; if it swings on a circular path, we call the emission circularly polarised. In the general case, a combination of both can be present, called elliptical polarisation.
A normal, thermally radiating body like the Sun emits only unpolarised emission as the processes creating the light are random and uncorrelated. It needs a process which imposes some ordering to produce polarised light. The MASER emission process mentioned above is such a process, since the creation of coherent emission requires the emitting plasma particles to radiate as a whole, single entity ("emitting in phase").
Polarisation is a reliable indicator that the emission process is non-thermal and hence does not come as a surprise for pulsar emission. However, the high degree of it seen in pulsars is unusual. Also, in contrast to any other astronomical radio sources, this degree of polarisation is seen to be highest at lower frequencies.
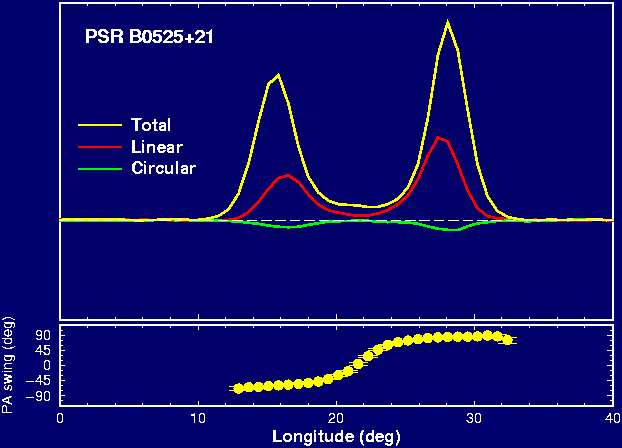
Pulsar emission is elliptically polarised whereas the linear component is usually stronger. Figure 4 shows the average profile and polarisation of PSR B0525+21 which is rather typical. The total measured intensity is shown in yellow. About 30% to 40% of that emission appears to be linearly polarised, and this linear intensity is shown in red. A green line indicates the level of circular polarisation also present. In the case of circular polarisation, the electric field component can travel clockwise or anti-clockwise on its circular path. Such a defined "handedness" is indicated by the sign (here: negative) of the green line.
|
|
Figure 4. The percentage polarisation and polarisation angle of pulsar PSR B0525+21 throughout its pulse. |
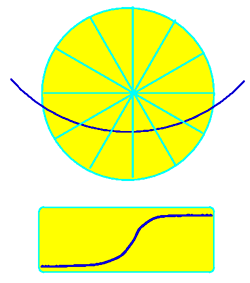
The existence of circular polarisation is difficult to understand for pulsars. The reason is that the plasma creating the emission is forced to stream along the magnetic field lines as indicated in section 2.1. The strength of the magnetic field should not allow any movement away from the field lines which should be necessary to create circular polarisation. In fact, we know that this is true since the plane of polarisation for the linear component varies in a systematic manner, i.e. in an S-like shape as shown by the dotted line for PSR 0525+21 above. This S-like shape has a geometrical origin:
|
|
Figure 5. At top, a model of the pulsar beam seen end-on with a line of sight which cuts across it as the pulsar rotates. The resulting change in polarisation angle is shown below. |
Figure 5 shows a model of the circular pulsar beam viewed from above. In the centre is the pulsar's magnetic axis and the field lines are indicated as radial lines. Plasma streams along these lines and the plane of linear polarisation must lie along these directions. When our line-of-sight cuts the beam as indicated, the actually observed plane of polarisation is a projection onto this line-of-sight, resulting in the S-like shape.
The S-like curve changes its
shape depending on the location of the line-of-sight as well as the
angle between the pulsars magnetic and rotation axes. Hence, by
measuring the linear polarisation and the S-curve, we can infer the
relative geometry of pulsar and Earth as well as the inclination of
the magnetic axis.
2.6 Radio spectrum of pulsars
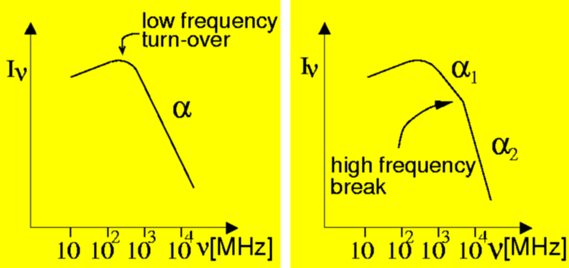
Pulsar emission is rather weak compared to the emission of other radio sources, and large, sensitive telescopes are required to pick up their emission. The maximum intensity is received at a frequency around 400 MHz, see Figure 6. Below this maximum, and in particular above it, the emission intensity falls rapidly with frequency. This is expressed by the radio spectrum of pulsars, plotting the pulsar intensity as a function of frequency.
|
|
Figure 6. Spectrum of a pulsar showing intensity versus frequency in MHz. |
The so called spectral index describing the decrease of intensity with increasing frequency is among the steepest of all radio sources, making pulsar observations at radio frequencies above 1 GHz (103 MHz) particularly difficult. The situation becomes even worse since for many pulsars the spectrum steepens even further above a few GHz (right-hand panel of Figure 6). This property has to be taken into account when planning searches for new pulsars, or when doing experiments as described below.
2.7 Emission heights
At the beginning of this section we had indicated that the radio emission is created some distance above the pulsar surface. One can infer these emission heights by various methods (among which is the measurement of the polarisation properties). The values obtained agree quite well and we measure heights of typically a few hundred km above the surface. It is remarkable that we are able to make these measurements of regions only 100's km across from a distance of thousands of light years away!
|
|
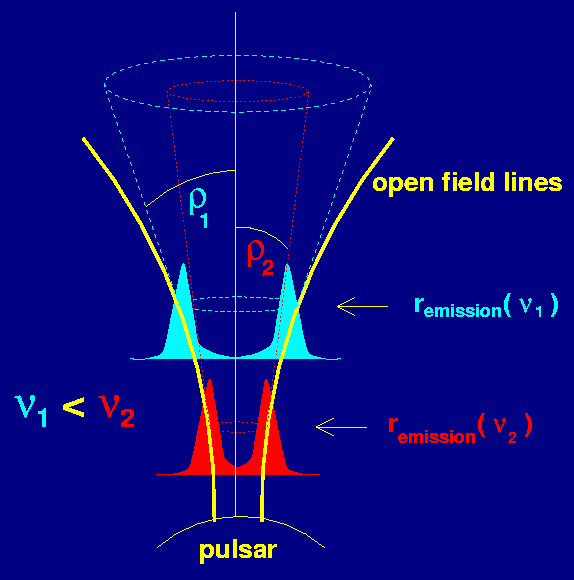
Figure 7. variation of pulse profiles and frequency of radio emission with height above the neutron star surface. |
These measurements also indicate that the emission heights depend on frequency, such that emission observed at high radio frequencies is created closer to the neutron star than that received at lower radio frequencies, Figure 7.
This creation of radio emission of different frequencies at different
heights allows interesting experiments to be performed: by observing
pulsars simultaneously at different frequencies, we receive the
emission simultaneously from different heights. This allows us to cut
slices out of the magnetosphere and to study the emission processes in
much more detail. As a radio telescope can usually observe only at a
single frequency at any time, multiple telescopes are necessary for
these experiments. But large telescopes necessary to receive the weak
pulsar emission are rare, and hence international collaboration is
required. The "European Pulsar
Network" is a collaboration of all major European observatories
studying pulsars.
 This animation shows single
pulses at two different frequencies (again from PSR B0329+54) obtained in such a European
experiment using the Lovell telescope at Jodrell Bank and the 100-m
Effelsberg radio telescope near Bonn in Germany.
|
You can browse a large number of pulsar data on the resources website at Jodrell Bank.
