
![]()
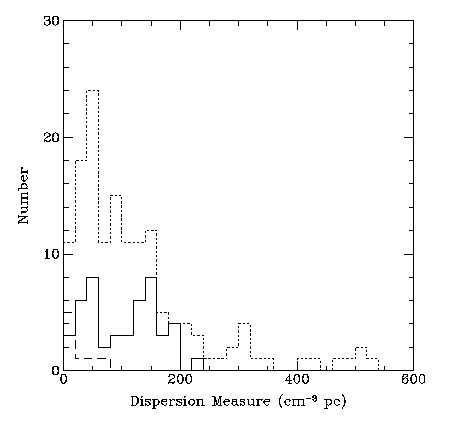
Figure 16: The observed distribution of pulsar dispersion measures. Dotted
curve is the total known population, solid curve is the Parkes survey.

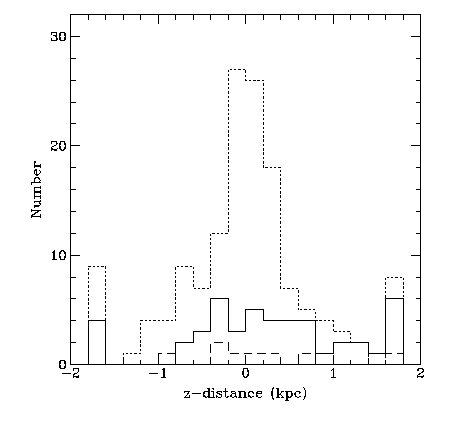
Figure 17: The observed distribution of pulsar distances above the galactic
plane. Dotted curve is the total known population, solid curve is the Parkes
survey.

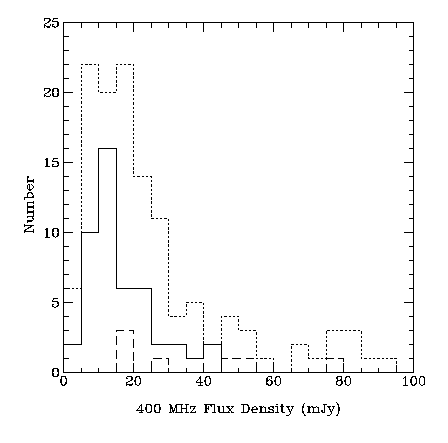
Figure 18: The observed distribution of pulsar flux densities. Dotted
curve is the total known population, solid curve is the Parkes survey.